Captain Ewave Weekly Charts Post!
Weekly Gold Cash Chart: https://captainewave.com/wp-content/uploads/2026/02/EWFEB1526GOLD.png
Long Term Update:
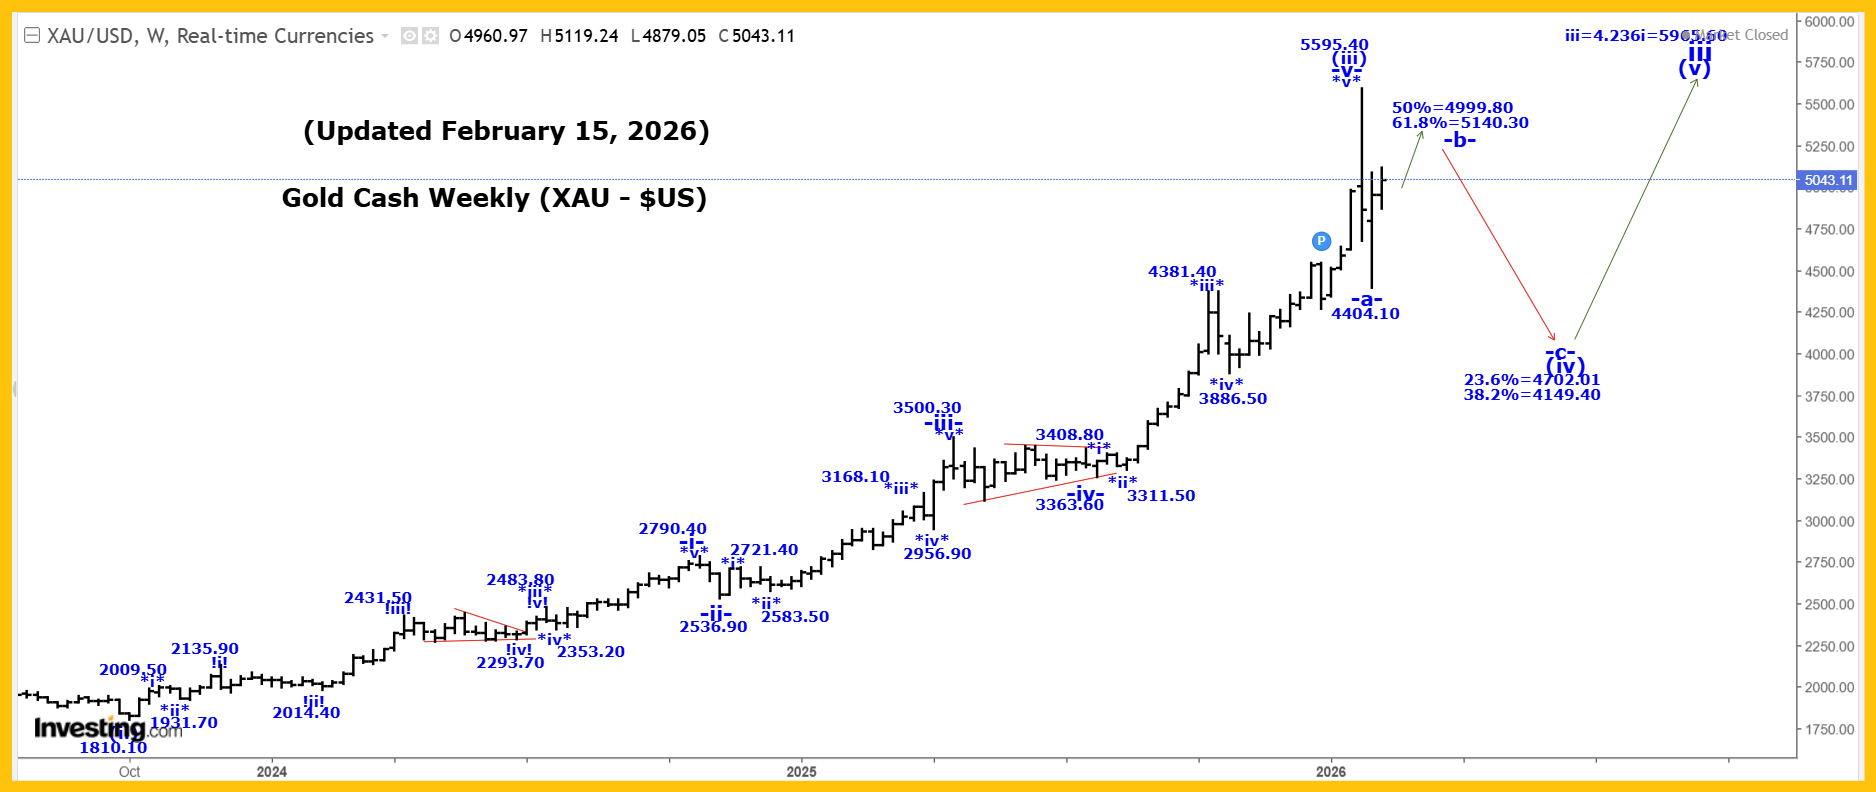
Gold was higher again this past week reaching a high of 5119.20, closing at 5043.10!
Our current long-term gold count starting from the 35.20 low made back in 1971, which remains incomplete, is as follows:
1 = 1920.80.
2 = 1046.20.
3:
i = 2073.40.
ii = 1614.40.
iii:
(i) = 2073.30.
(ii) = 1810.10.
(iii):
-i- = 2790.40.
-ii- = 2539.90.
-iii- = 3500.30.
-iv- triangle = 3363.60.
-v- = 5595.40, to complete all of wave (iii).
(iv):
-a- = 4404.10.
-b- rally is still underway.
-c- drop after wave -b- ends to complete all of wave (iv).
A very powerful wave (iii) of iii is now complete at the 5595.40 high and we now falling in a multi-month wave (iv), correction that has the following retracement levels:
23.6% = 4702.00
38.2% = 4149.40.
Within wave (iv) we likely completed a five wave drop to complete all of wave -a- at 4404.10 low and if that is the case then we are now moving higher in wave -b-, which has the following retracement levels:
50% = 4999.80.
61.8% = 5140.30.
We have now entered our retracement zone, but we doubt that all of wave -b- is already complete. After wave -c- ends we expect another drop in wave -c- to complete all of wave (iv).
Wave (iv) could also become much more complex than we are currently suggesting, as we do expect very high volatility within wave (iv) as it develops over the next 3 to 6 months and perhaps for the rest of 2026.
Projections for the end of wave 3 are:
3 = 2.618(1) = 5936.00.
3 = 4.236(1) = 9033.60.
Active Positions: Flat!
Silver:
Weekly Silver Cash Chart: https://captainewave.com/wp-content/uploads/2026/02/EWFEB1526SI.png
Long Term Update:
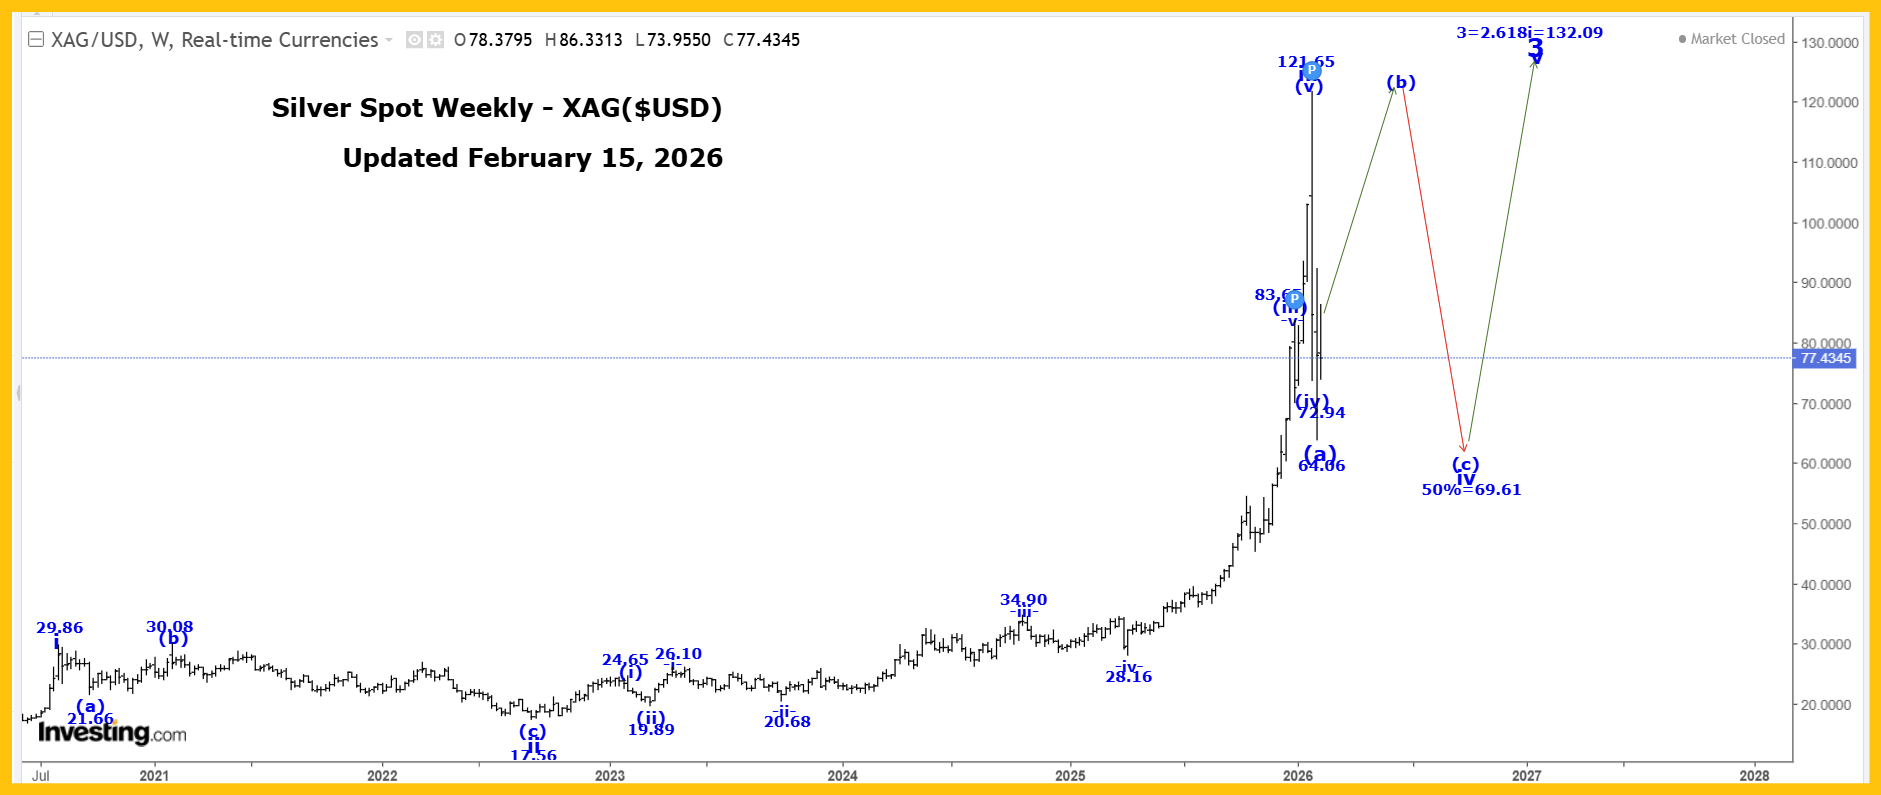
Silver was initially higher this past week reaching a high of 86.33, although after that high was made we moved lower reaching a low of 73.96, closing marginally lower of 77.44!
A very powerful wave iii ended at the 121.65 high and we are now falling in a multi-month wave iv correction that has the following retracement level:
50% = 69.61.
We have now reached our 50% retracement level, but we still doubt that all of wave iv is complete at the 64.06 low and we likely just completed a three-wave structure wave (a) of iv at that low. If that is the case, then we should now be moving higher in wave (b).
Since the wave (a) drop was a three-wave structure we should assume that wave iv is going to become a flat, irregular or even a bullish triangle corrective pattern.
In all of these cases, wave (b) is likely heading back to the 121.65 high, or very near it and may even it exceed it… before it ends!
After wave (b) ends we expect a wave (c) drop, that should return to at least the wave (a) low of 64.06, except in the case of bullish triangle where we will not revisit that low before wave iv ends. We do expect very high volatility as wave iv develops.
We note that wave (b) is tradeable, but it will a choppy ride, as it will be full of three wave structures, and perhaps even a bullish triangle.
In the very long term, we completed all of wave III at 49.00 in 1980 and all of wave IV at 3.55 in 1993. We are now working on wave V and within wave V we have the following count:
1 = 49.56.
2 = 11.64,
3 projection is updated to 3 = 2.618(1) = 132.09.
Active Positions: Long through PSLV:TSX!
US 10 Year Bond Yield:
Monthly US 10 Year Bond Chart: https://captainewave.com/wp-content/uploads/2026/02/EWFEB1526BOND.png
Long Term Update:
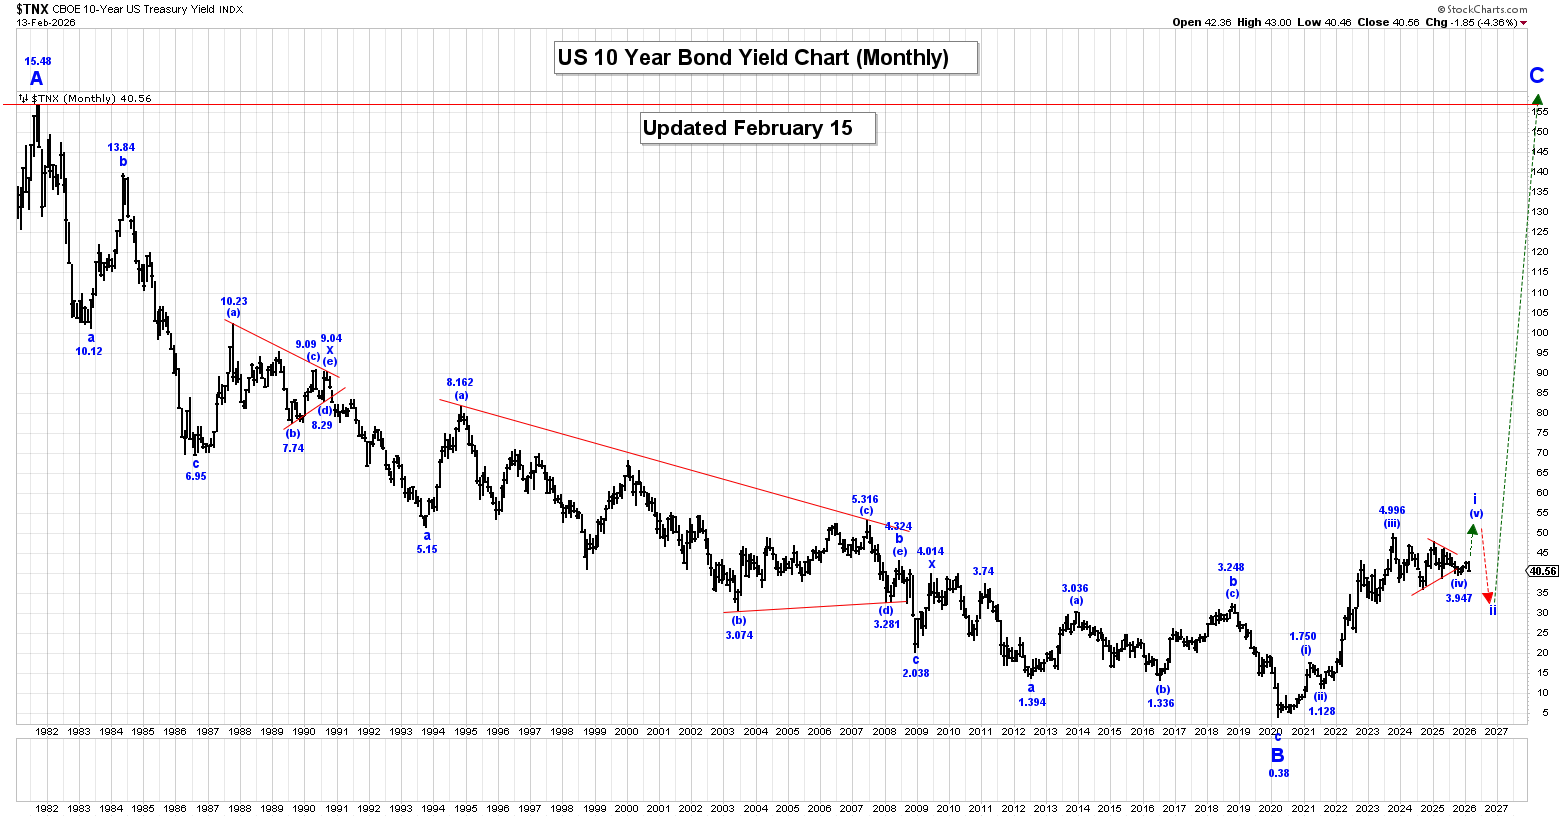
The 10 Year US Bond Yield was lower again this past week, reaching a low of 4.043%, closing at 4.056%
Within a multi-year wave C, we are rallying in wave i, which is now still underway.
Within wave i, we completed wave (i) at 1.266%, wave (ii) at 0.504%, wave (iii) at 4.997% and our large wave (iv) bullish triangle at the 3.947% low.
We are now thrusting and subdividing higher in wave (v) to complete all of wave i and therefore expect higher yields in the months ahead.
After wave i ends we expect a wave ii, correction that retraces between 50 to 61.8% of the entire wave i rally.
On our Long-Term Monthly Chart all of wave A ended at the 15.83 high in 1981 and since that high was made, we have fallen in a triple 3 wave correction within wave B that ended at the 0.38% level.
We are moving higher in a multi-year wave C, that will eventually see rates reach at least the 15.83 high again.
Active Positions: Long risking to 3.880%!
Crude Oil:
Weekly Crude Oil Chart: https://captainewave.com/wp-content/uploads/2026/02/EWFEB1526OIL.png
Long Term Update:
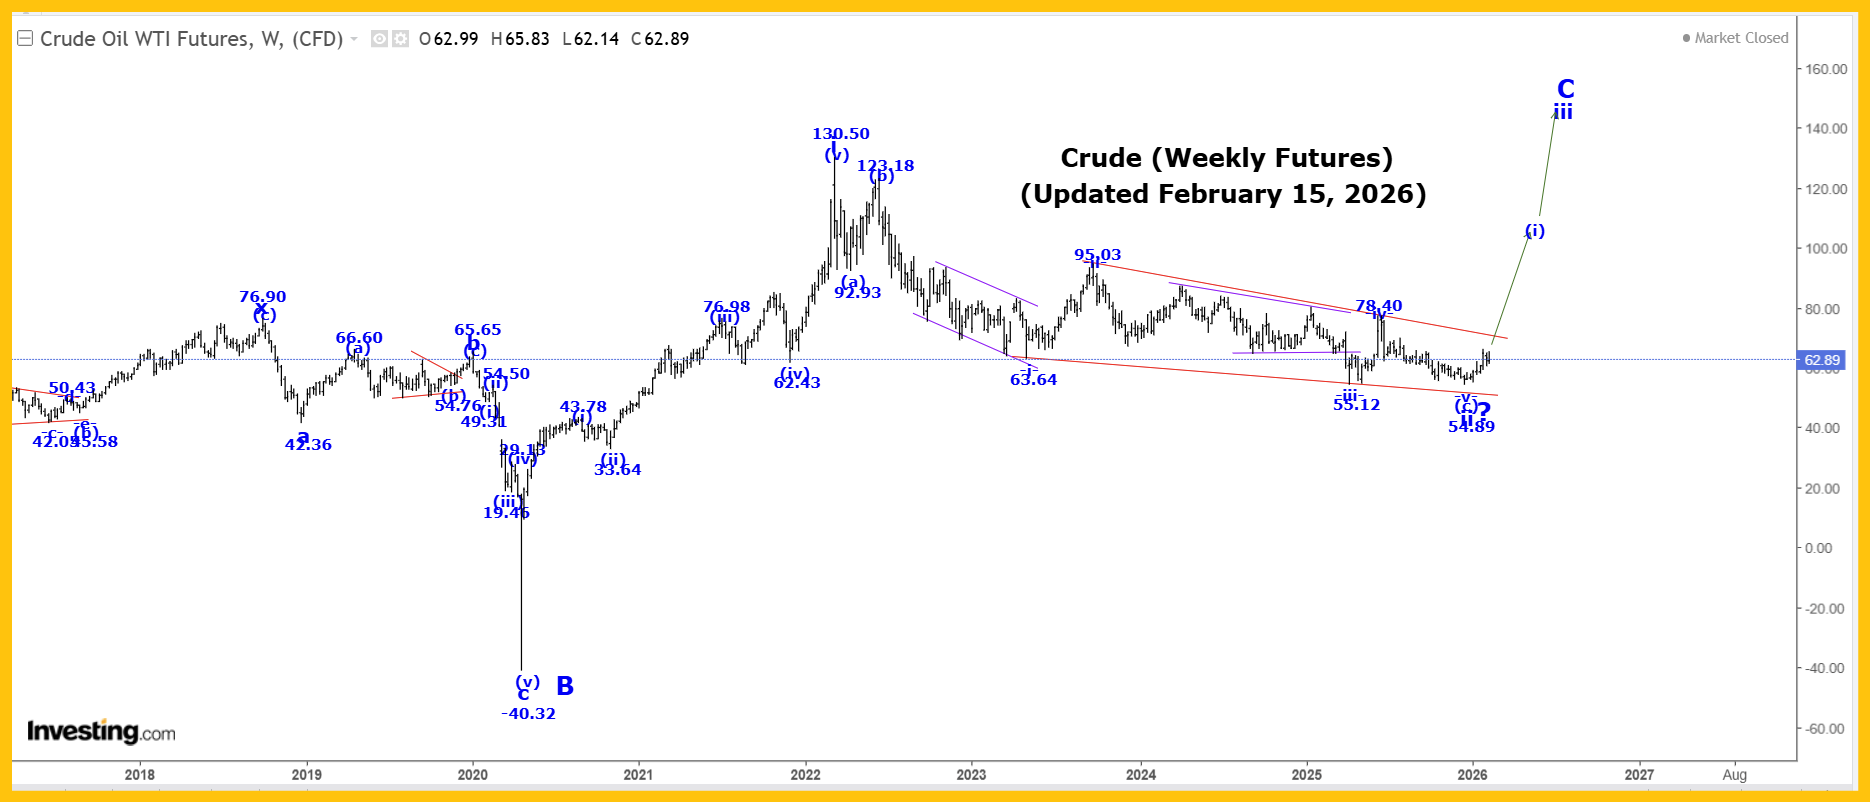
Crude was initially higher this past week reaching a high of 65.83, although after that high was made we moved lower reaching a low of 62.14, closing at 62.84.
Our internal wave count for wave ii to looks like:
(a) = 92.93.
(b) = 123.18.
(c) diagonal triangle:
-i- = 63.64.
-ii- = 95.03.
-iii- = 55.12.
-iv- = 78.40.
-v- = 54.89, if complete.
We have now completed the minimum requirement for an end of our wave -v- ending diagonal triangle formation at the 54.89 low, although only a break of the upper red trendline connecting 95.03 and 78.40 will confirm this to be the case.
After wave ii ends, we expect a very sharp rally higher in wave iii, and we will provide our projected endpoint for its completion after wave ii ends.
In the long term we are now rallying in wave C that has the following projections:
C = A = 153.77.
C = 1.618A = 244.78.
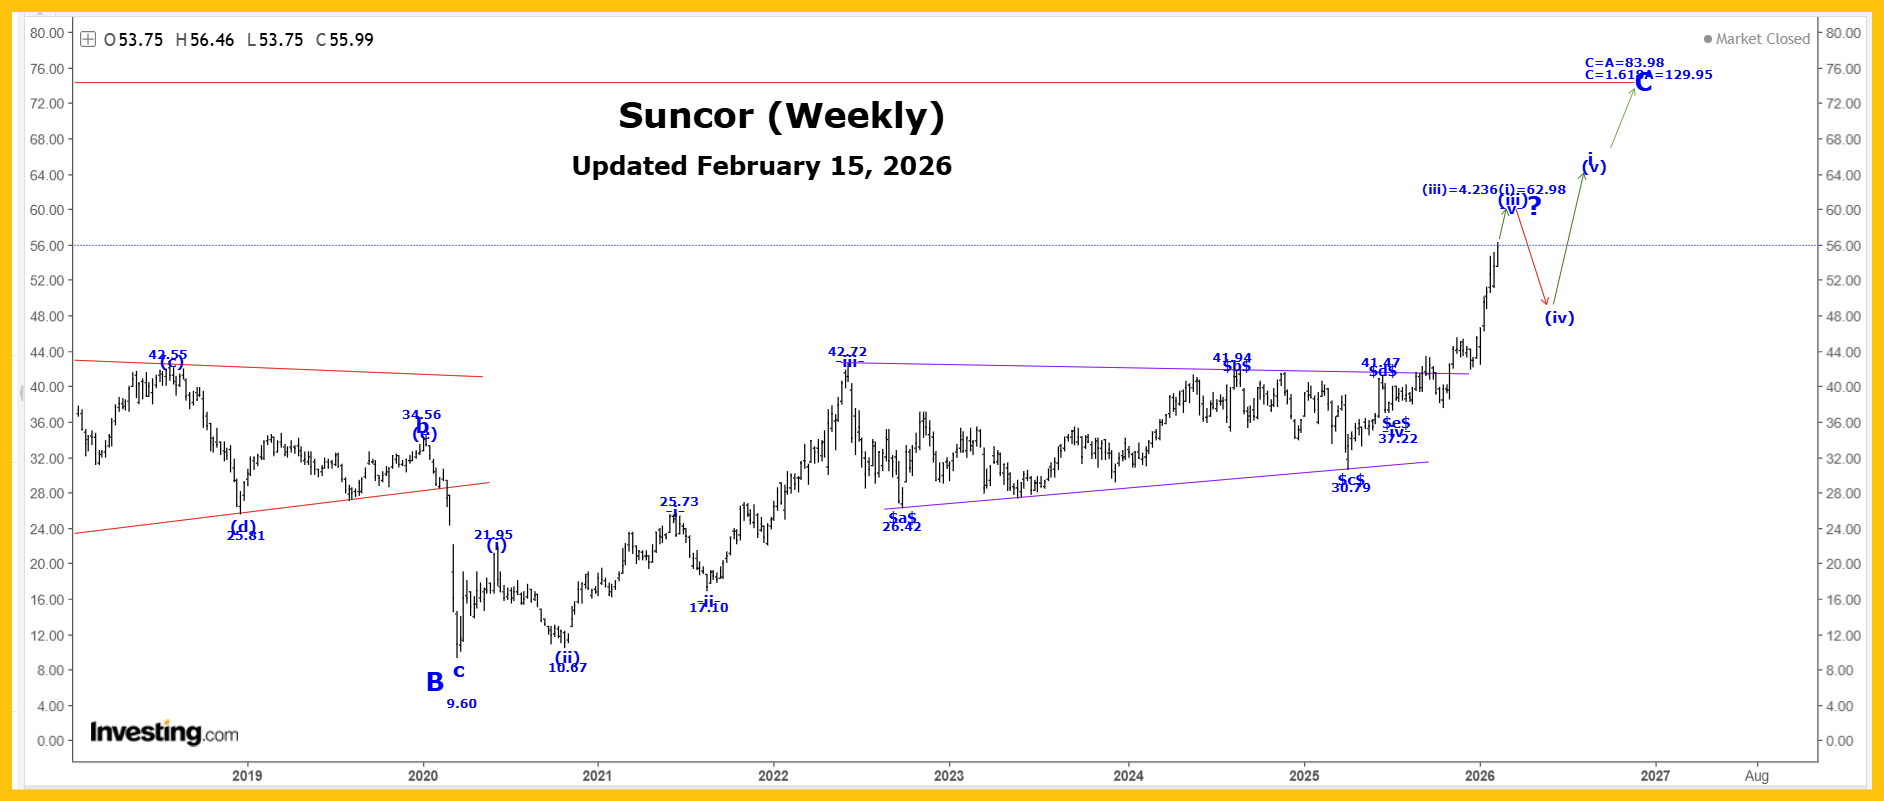
Suncor:
Weekly Suncor Chart: https://captainewave.com/wp-content/uploads/2026/02/EWFEB1526SU.png
Long Term Update:
Suncor was higher again this past week reaching a high of 56.46, closing at 55.99!
Wave (iii) is still underway and moving higher to next projected endpoint of:
(iii) = 4.236(i) = 62.98.
We expect higher prices as wave -v- of (iii) continues to develop.
Active Positions: Long crude, with puts as a stop. Long Suncor!
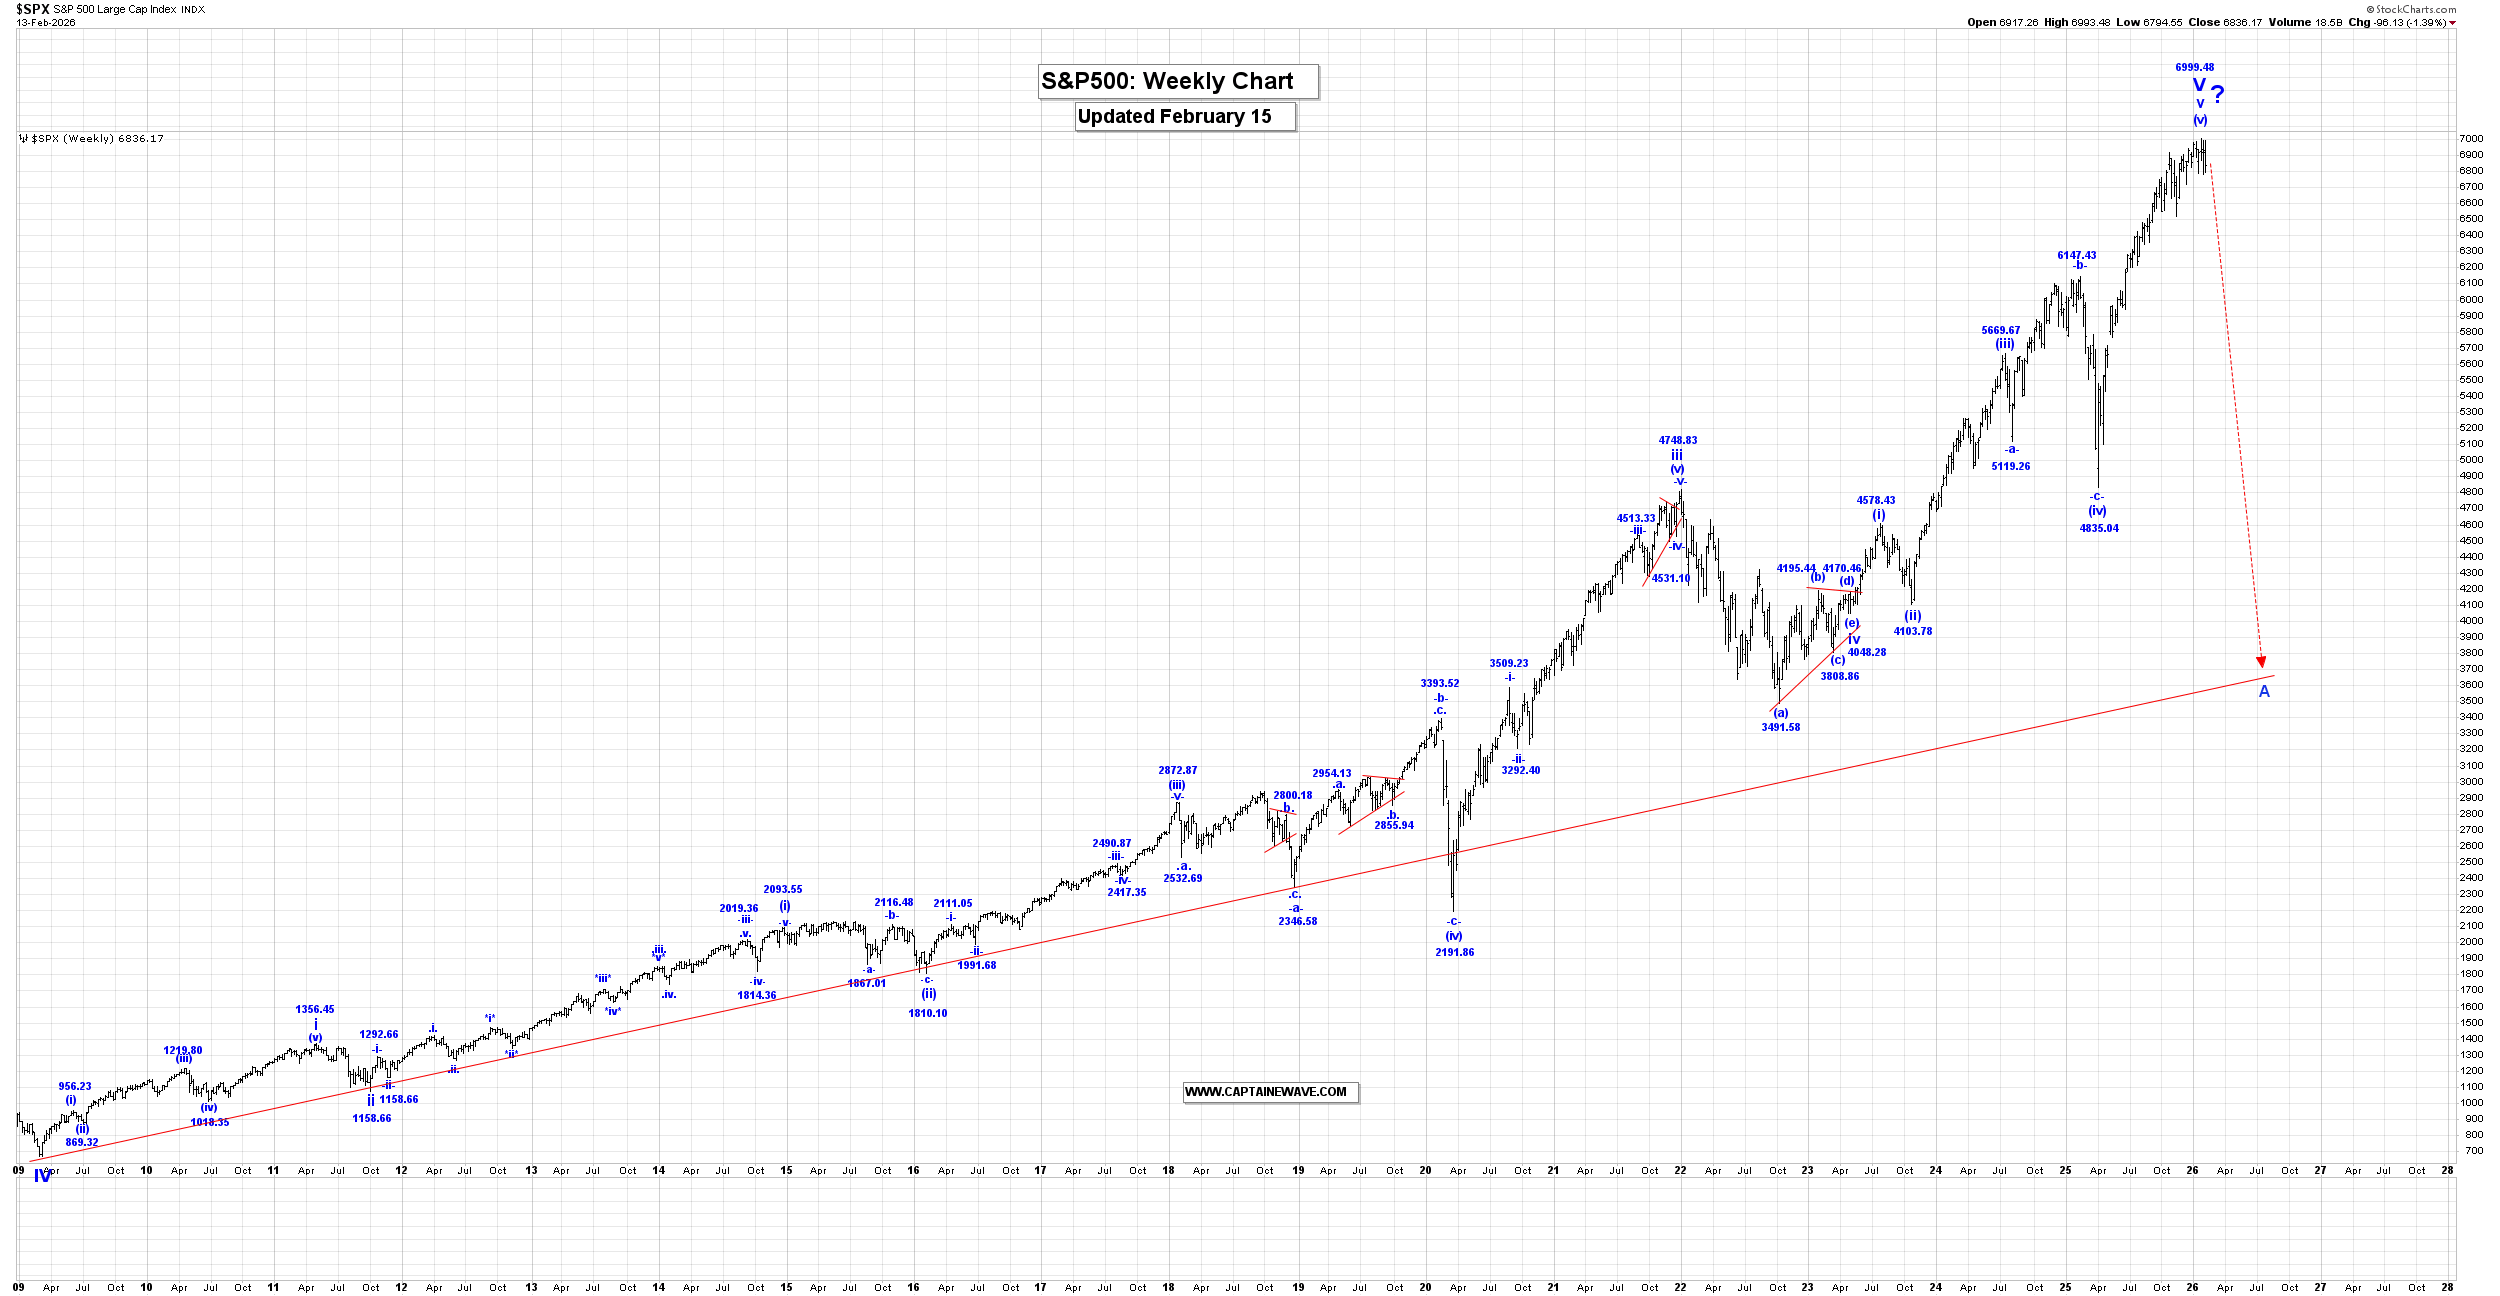
SP500:
Weekly SP500 Chart: https://captainewave.com/wp-content/uploads/2026/02/EWFEB1526SP.png
Long Term Update:
The SP500 initially higher this past week reaching a high of 6993.48, although after that high was made we moved lower reaching a low of 6794.55, closing at 6836.17!
Within v of V, wave (iv) ended at 4835.04 and we are moving higher in wave (v), which has the following updated internal wave count:
.i. = 5381.55.
.ii. = 5104.34.
.iii. = 6427.02.
.iv. = 6214.43.
.v. = 6993.48, if complete.
We are waiting for confirmation that our wave $v$ of .v. ending diagonal triangle formation is complete at the 6999.48 high, as opposed to expanding and extending further before it ends.
Active Positions: Flat!
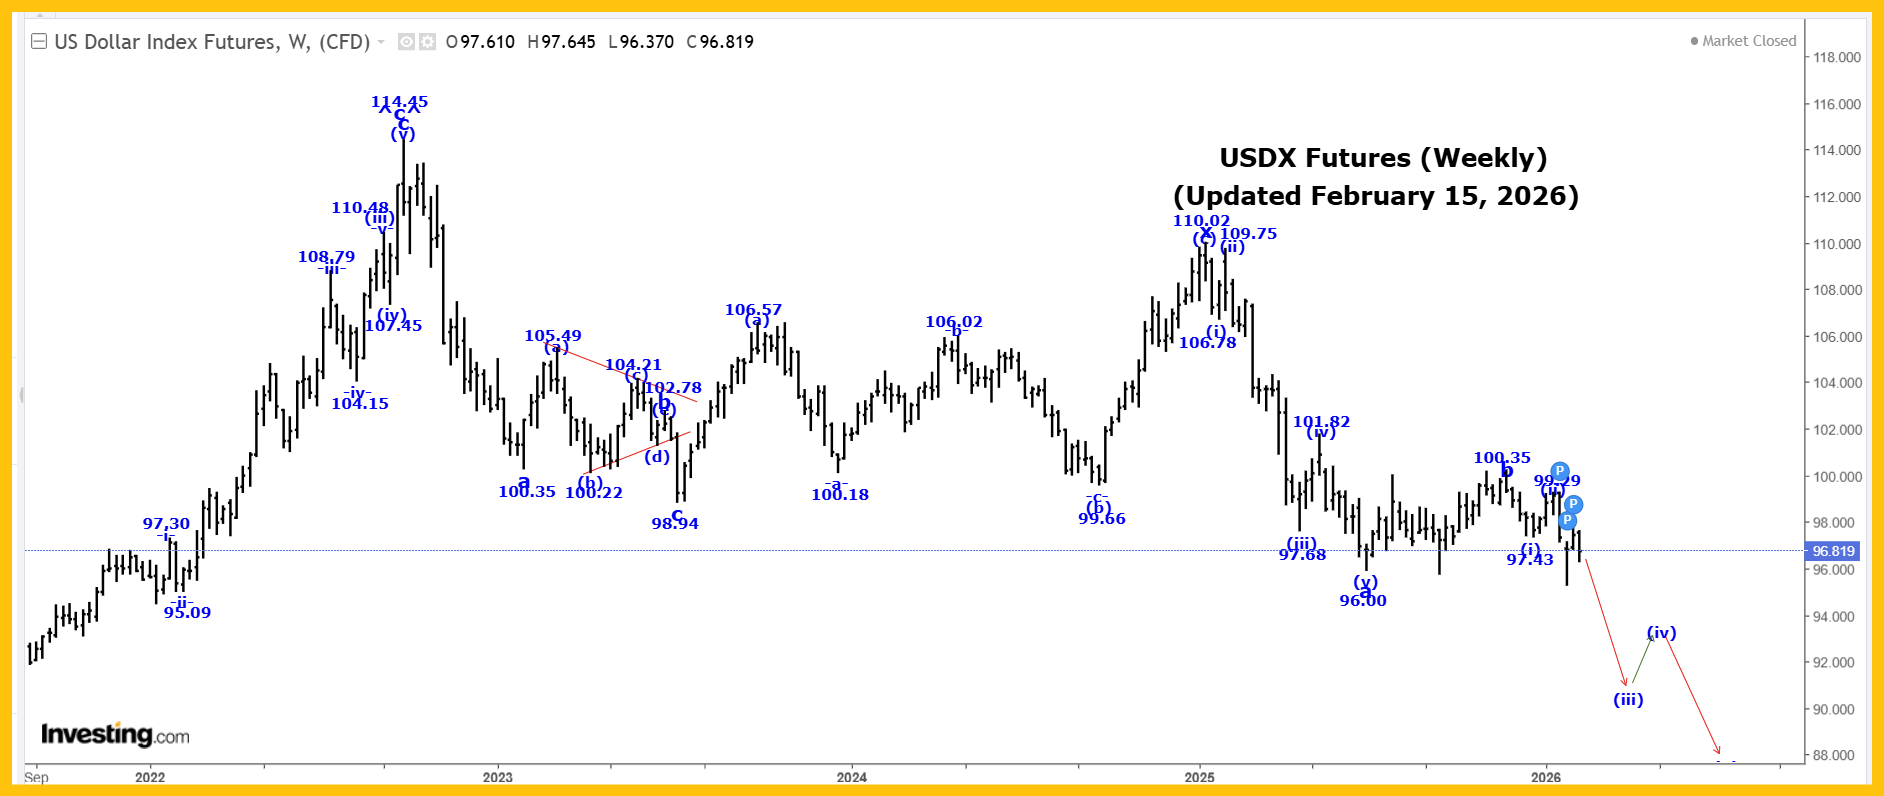
USDX:
Weekly USDX Chart: https://captainewave.com/wp-content/uploads/2026/02/EWFEB1526USD.png
Long Term Update:
The USDX was lower this past week reaching a low of 96.37, closing at 96.82.
We continue to work on a very large wave B bearish triangle and within that triangle all of wave ^c^ ended at the 114.75 high. We are now falling in wave ^d^.
Wave ^d^ cannot fall below the wave ^b^ low of 71.46 for this triangle formation to remain valid. Wave ^d^ needs to consist of at least one abc pattern but can have up to 3 such patterns.
We have now made a major revision to the internal wave structure of wave ^d^ and now believe that it will consist of at least 2 three wave patterns as follows:
a = 100.35.
b triangle = 102.78.
c = 98.94.
x = 110.02.
a = 96.00.
b= 100.35.
c drop is now underway.
We are now falling in second wave c, which is subdividing as shown in our Weekly and Daily USDX Charts. Its looks like all of wave (ii) is now complete at the 99.29 high and we should therefore be moving lower in subdividing wave (iii).
Active Positions: Short, risking to 105.00!
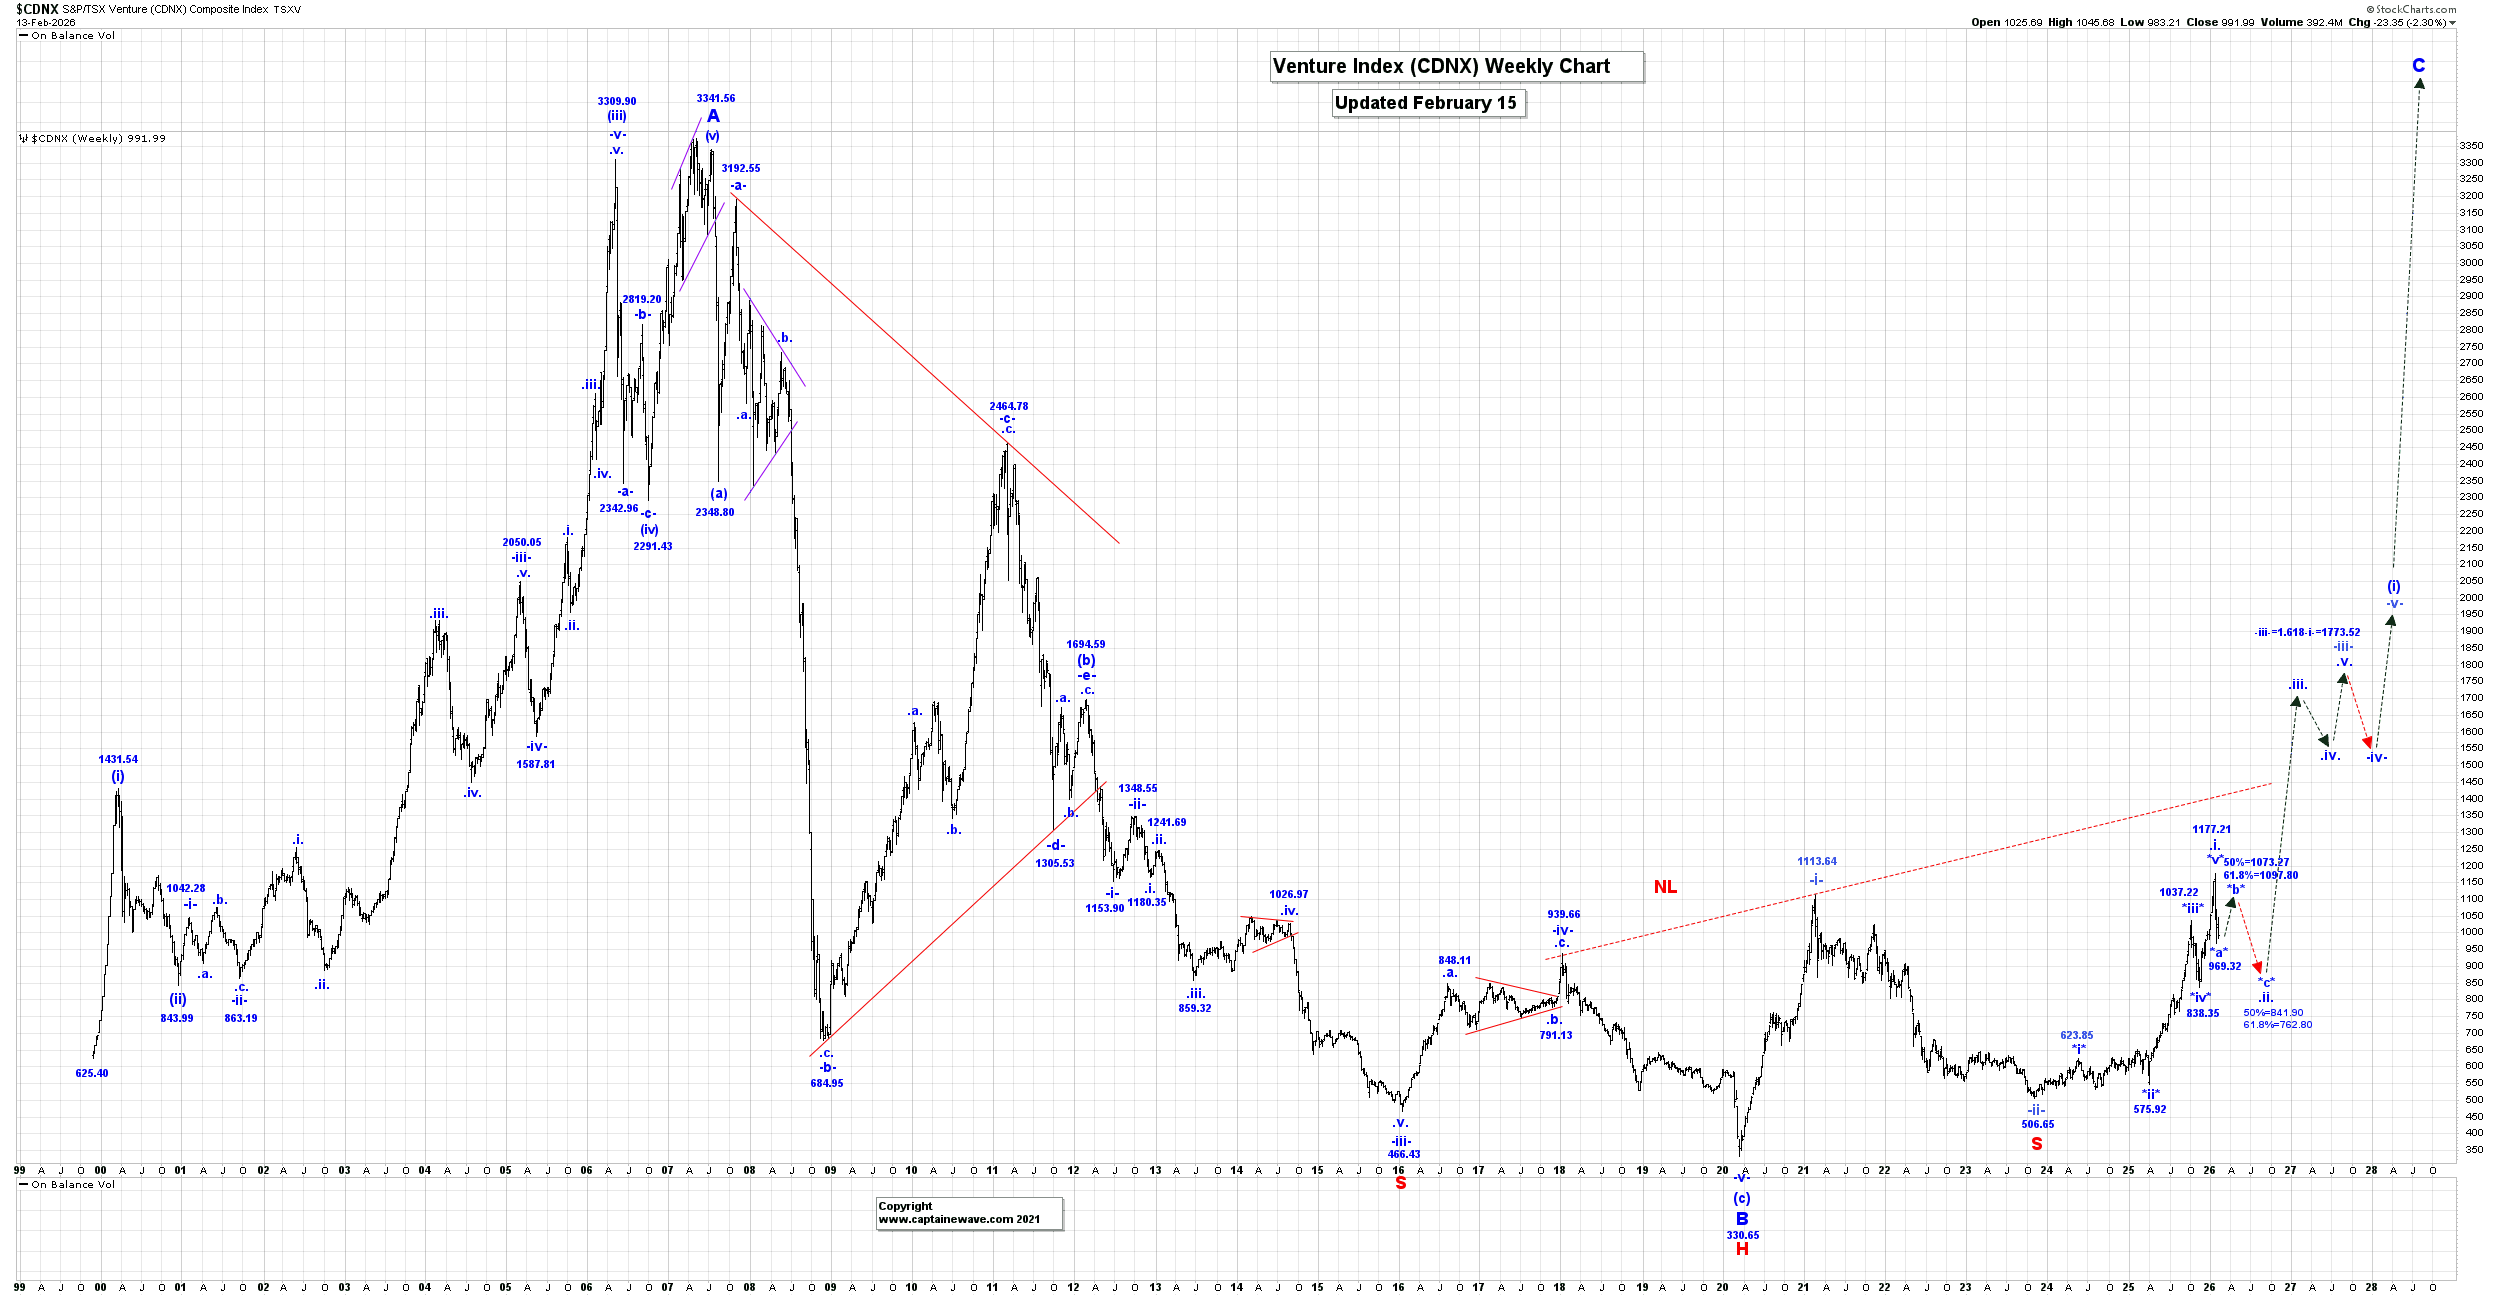
CDNX:
Weekly CDNX Chart: https://captainewave.com/wp-content/uploads/2026/02/EWFEB1526CDNX.png
Long Term Update:
The CDNX was initially higher this past week reaching a high of 1045.68, although after that high was made we moved lower reaching a low of 983.21, closing at 991.99!
Wave -ii- is now complete at the 506.65 low, and we are moving higher in wave -iii-, and within wave -iii- we are working on wave .i., which we believe is now complete at the 1177.21 high. If that is the case then we are now falling in wave .ii., which has the following retracement levels:
50% = 841.90.
61.8% = 762.80.
Within wave .ii. we likely completed a five-wave impulsive sequence at the 969.32 low and if that is the case then we should be moving higher in wave *b* that has the following retracement levels:
50% = 1073.27.
61.8% = 1097.80.
After wave *b* ends we expect another drop in wave *c* to complete all of wave .ii.
We expect it will take 3 to 6 months for wave .ii. to develop.
Longer term our initial projections for the end of wave -iii- is:
-iii- =-1.618-i- = 1773.52.
Our minimum multi-year long term target for the end of wave C is 3341.56.
Active Positions: Flat!
GDX:
Weekly GDX Chart: https://captainewave.com/wp-content/uploads/2026/02/EWFEB1526GDX.png
Long Term Update:
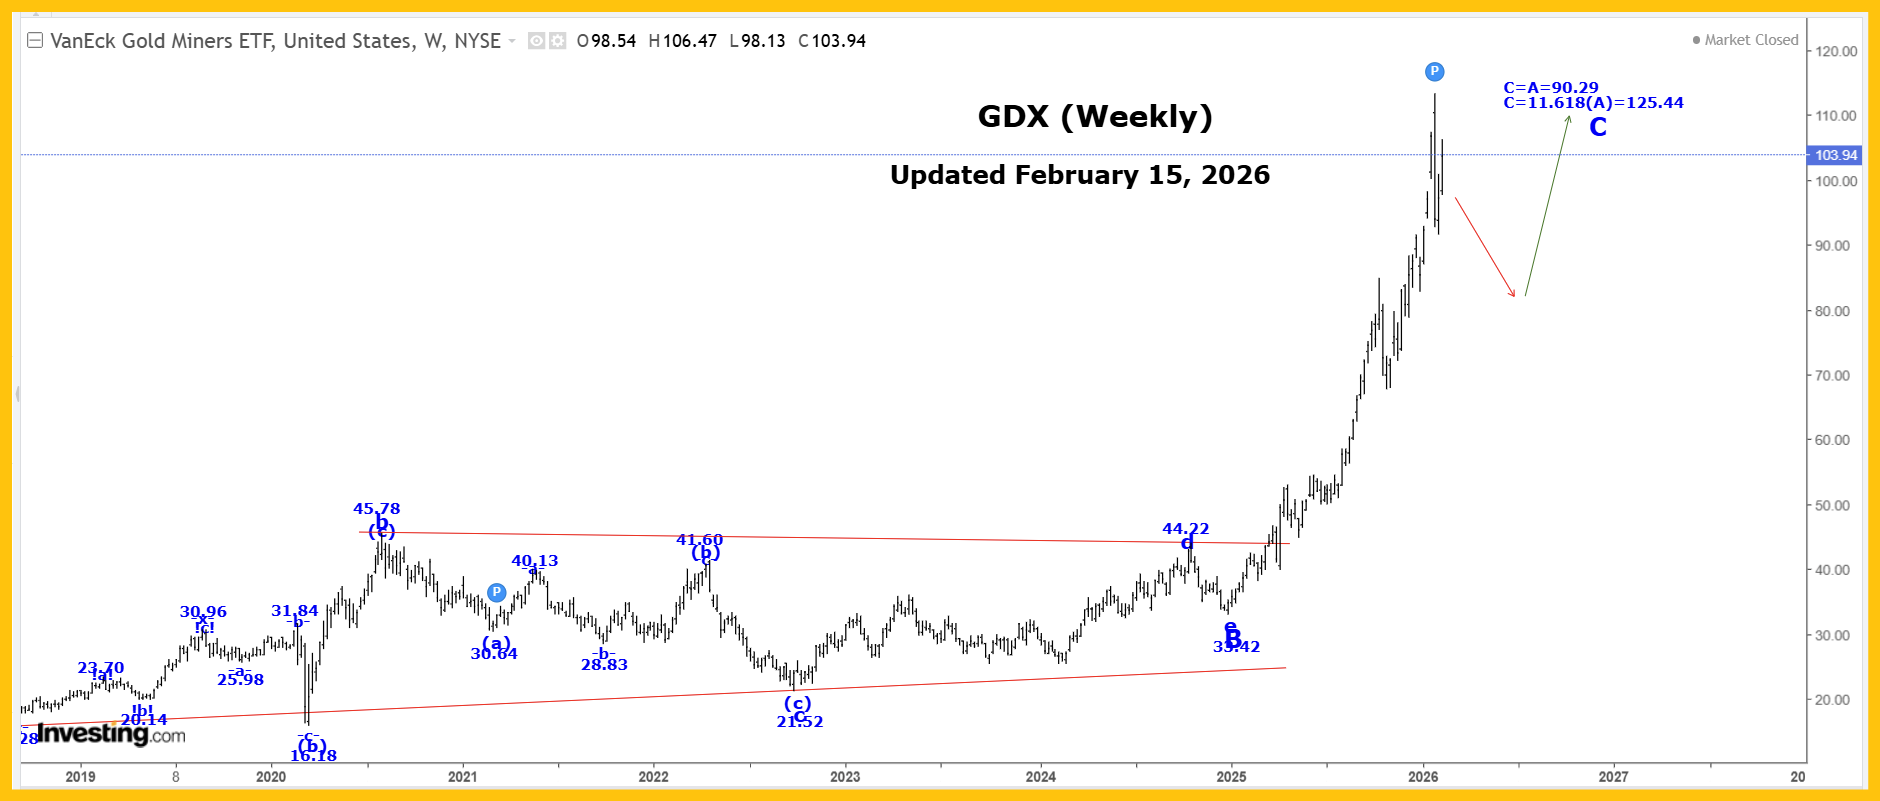
The GDX was higher again this past week reaching a high of 106.47, closing at 103.94!
All of wave A ended at the 56.67 high in 2008 and all of our bullish wave triangle at 33.42, and we are continuing to move higher in wave C.
Within wave C, we completed weave (i) at 42.57 and wave (ii) at 38.58 and we are now moving higher in wave (iii) as follows:
$i$ = 53.25.
$i$ = 45.10.
$iii$ = 113.50.
$iv$ drop is now underway.
$v$ rally after wave $iv$ ends to complete all of wave (iii).
Our retracement levels for wave $iv$ are:
23.6% = 97.36.
38.2% =87.37.
We have already reached our 23.6% retracement level, but we doubt that all of wave $iv$ is already complete and expect it will take 3 to 6 months and perhaps the rest of 2026 to develop.
Our current projection for the end of wave C is:
C = 1.618A = 125.44.
Within wave C, we completed wave (i) of i of C at 42.54, wave (ii) at 38.58, and we are still moving sharply higher in a subdividing wave (iii), as shown in our Daily and 60 Min GDX Charts.
Active Positions: Flat!
Bitcoin:
Weekly Bitcoin Chart: http://captainewave.com/wp-content/uploads/2025/06/EWJUN725BIT.png
Long Term Update:
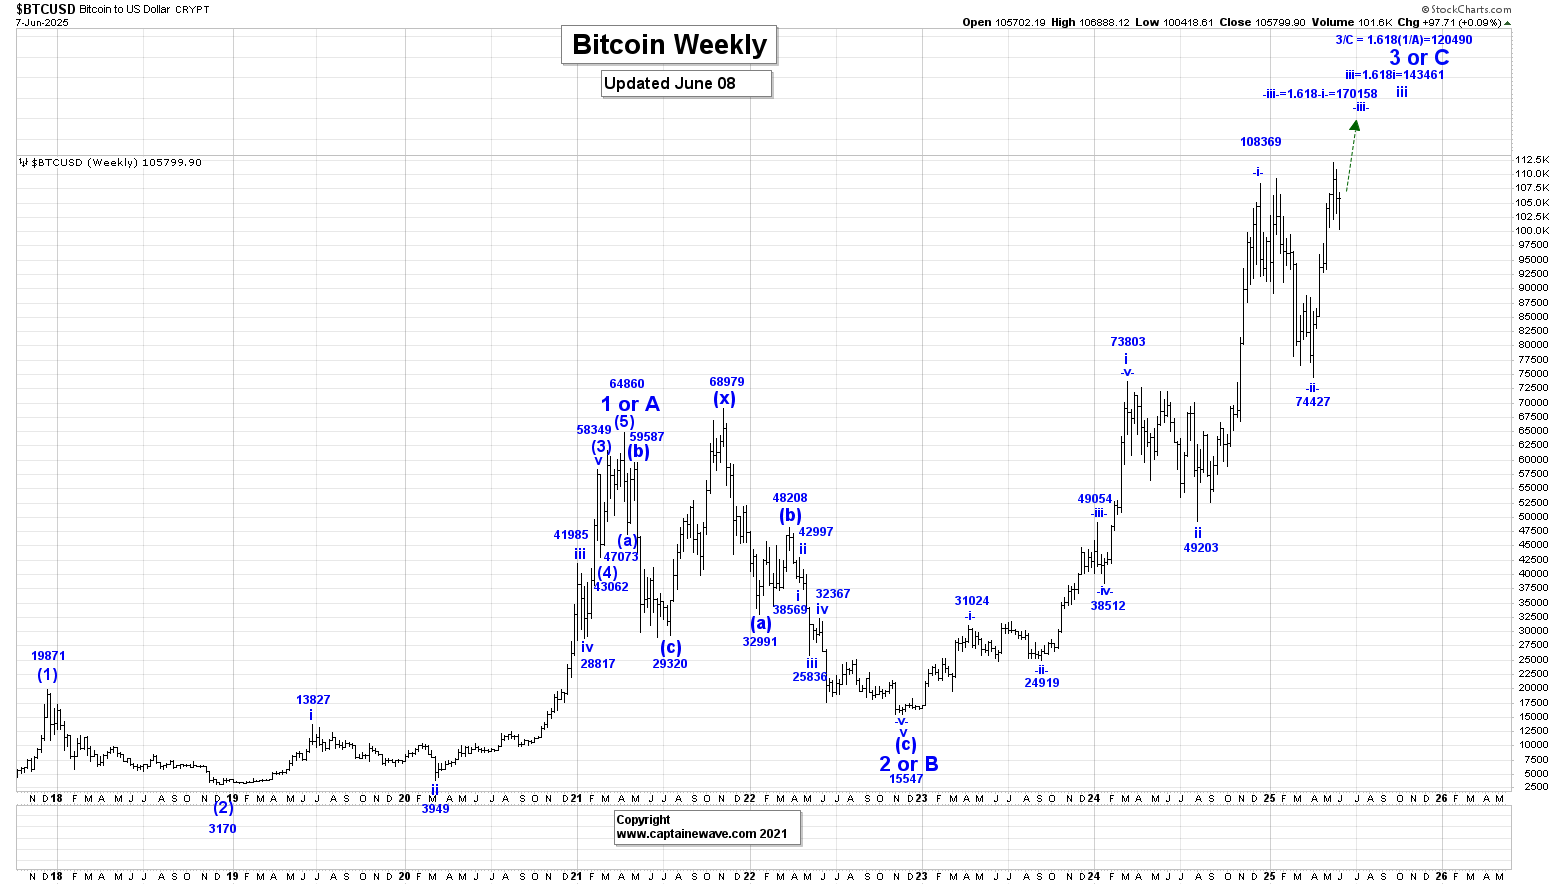
Bitcoin was lower again this past week reaching a low of 65,084, closing at 69,358!
We are now working on the assumption that since inception bitcoin has now completed a five-wave impulsive rally at the 126,287 high, to complete wave 1. We are now falling in wave 2, which has a retracement zone of:
50% = 63,144.
61.8% = 48,242.
Within wave 2, we likely completed wave -a- at 60,070, and if that is the case we are now moving higher in wave -b-, which as the following retracement levels:
50% = 93,179.
61.8% = 100,992.
After wave -b- ends we expect another drop in wave -c- back to at least the wave -a- low to complete all of wave 2.
Active Positions: Flat!
Thanks!
Captain & Crew