Captain Ewave Morning Post!
Please click here for the Bob Balan Ewave Basics Handbook… which the Captain highly recommends:
https://captainewave.com/wp-content/uploads/2021/04/Ewave-Basics.pdf
Don’t try to learn Ewave all in one day. Focus on when the Captain is buying or selling, and the big wave counts.
From there, add more detail to your study.
If any sub needs one-on-one help with the wave counts, just some handholding during market dips, or both, shoot us an Email we’ll work out a phone talk time slot. Can buy a one-time slot or multi… Thanks, Captain & Crew
CDNX:
CDNX Chart:
https://captainewave.com/wp-content/uploads/2023/07/ewjul2123cdnx.png
Short Term Update:
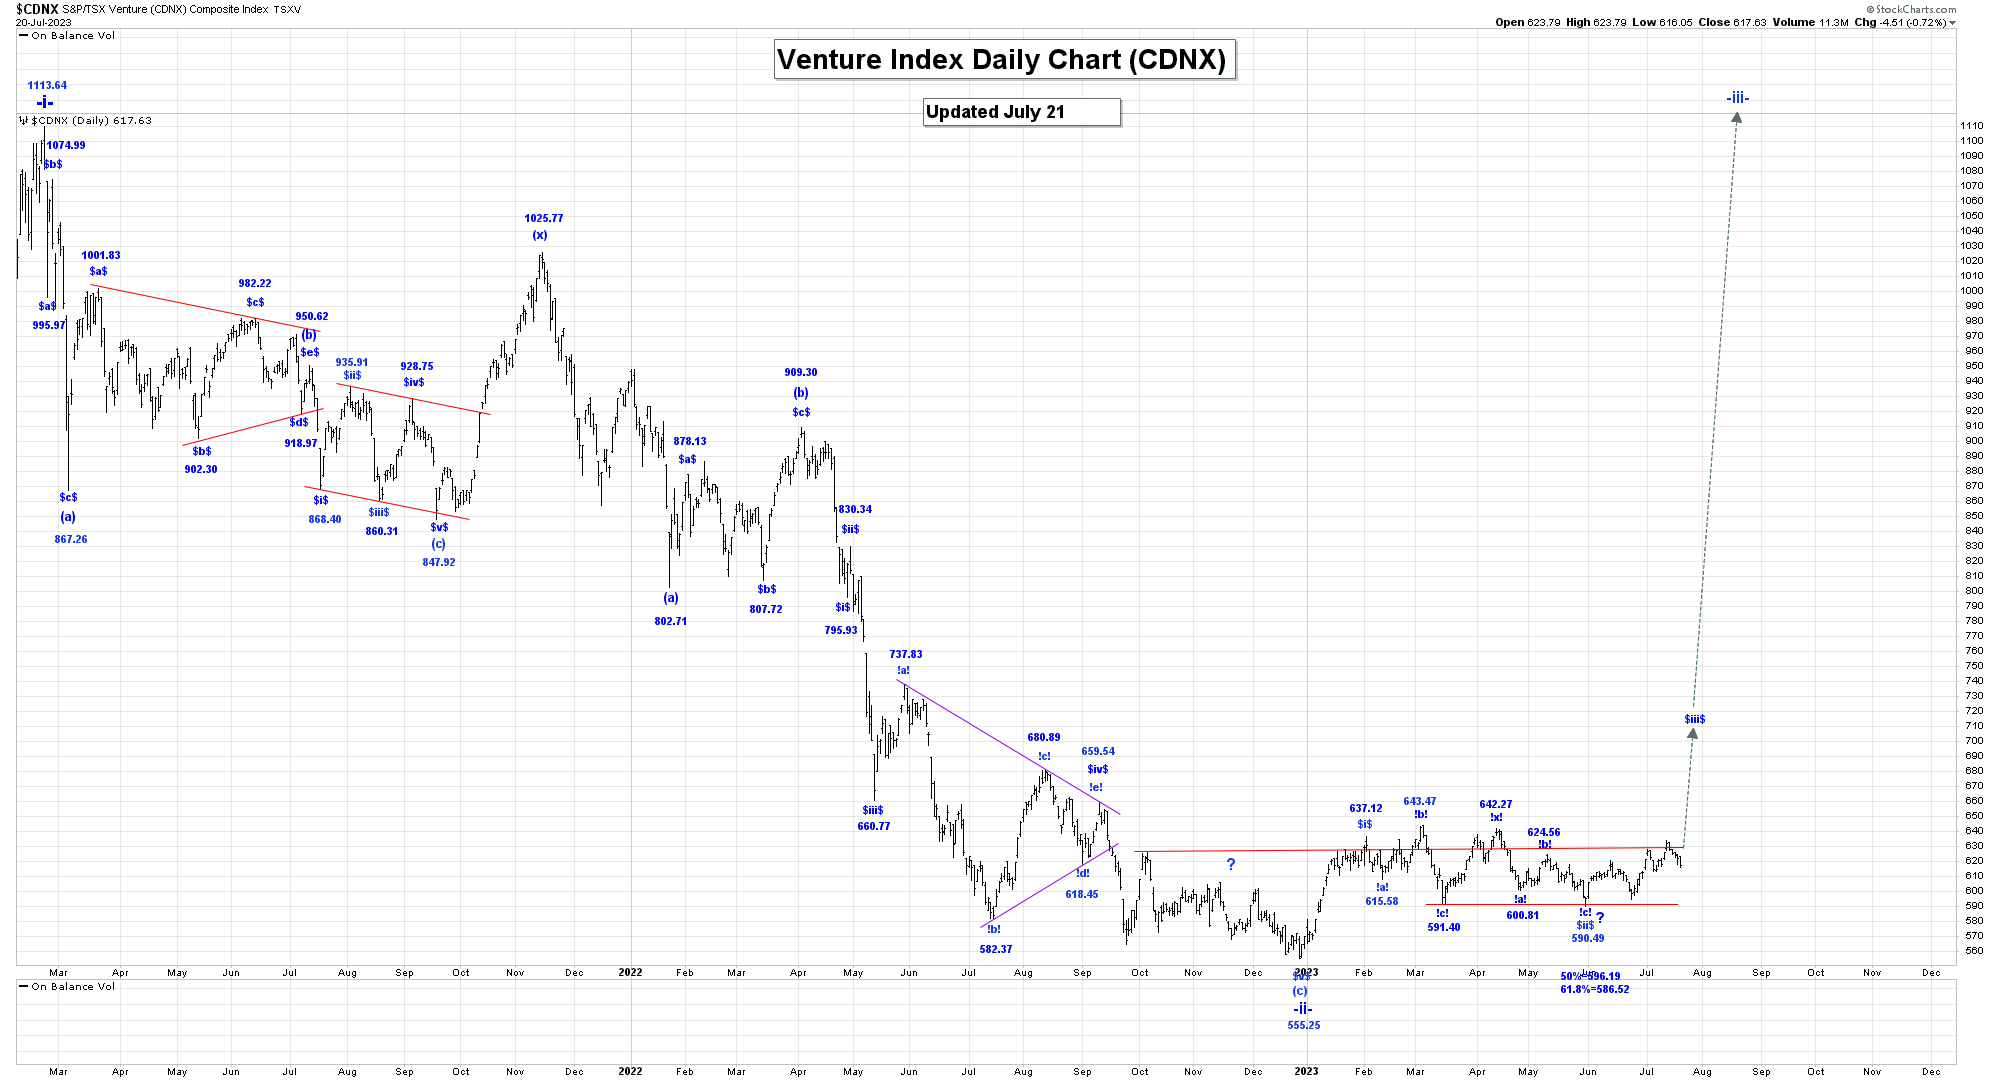
The CDNX was lower in yesterday’s trading session reaching a low of 616.05, closing at 617.63.
We continue to work on the assumption that all of wave -ii- is complete at the 555.25 low, although we are currently not sure what our internal count for wave $v$ of (c) of -ii- looks like.
We will need to take another look at what is going on.
If wave -ii- ended at the 555.25 low then within wave -iii-, we are now rallying in wave (i). Within wave (i), it looks like all of wave $i$ ended at the 637.12 high and we are now falling in a more complex double 3 type wave $ii$ correction. Our retracement levels for all of wave $ii$ are:
50% = 596.19;
61.8% = 586.52.
Within wave $ii$, our first 3 wave pattern ran from 637.12 to 591.40, which was then followed by a wave !x! rally that ended at 642.27. We are now falling in our second 3 wave pattern with wave !a! ending at 600.81 and wave !b! at the 624.56 high.
We have now reached our minimum target for the end of our second wave !c!, so we need to be on guard for the completion of all of wave $ii$ and the start of another rally in wave $iii$.
We will provide our initial projection for the end of wave $iii$, when we believe that all of wave $ii$ is complete.
Trading Recommendation: Go Long the GDXJ as a long-term hold.
Active Positions: Heavily long the GDXJ and key juniors on the CDNX, as a long-term hold!
GDX & Gold Stocks:
GDX 60 Min Chart:
https://captainewave.com/wp-content/uploads/2023/07/ewjul2123gdx60.png
GDX Daily Chart:
https://captainewave.com/wp-content/uploads/2023/07/ewjul2123gdxd.png
Short Term Update:
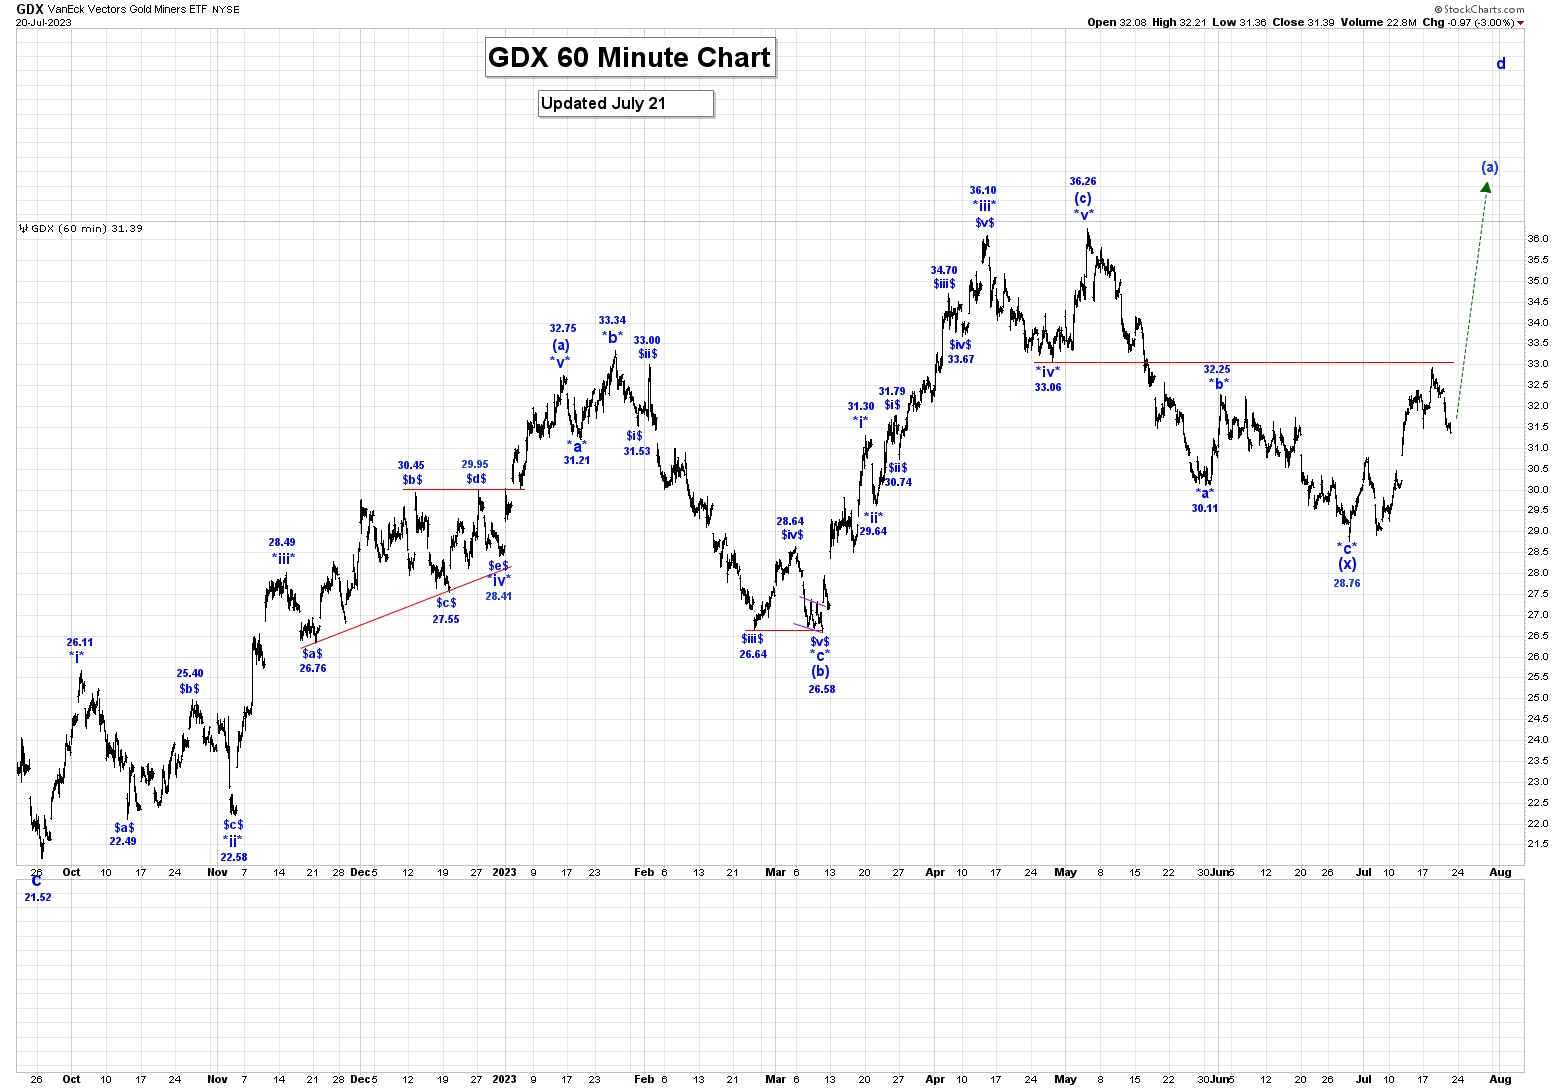
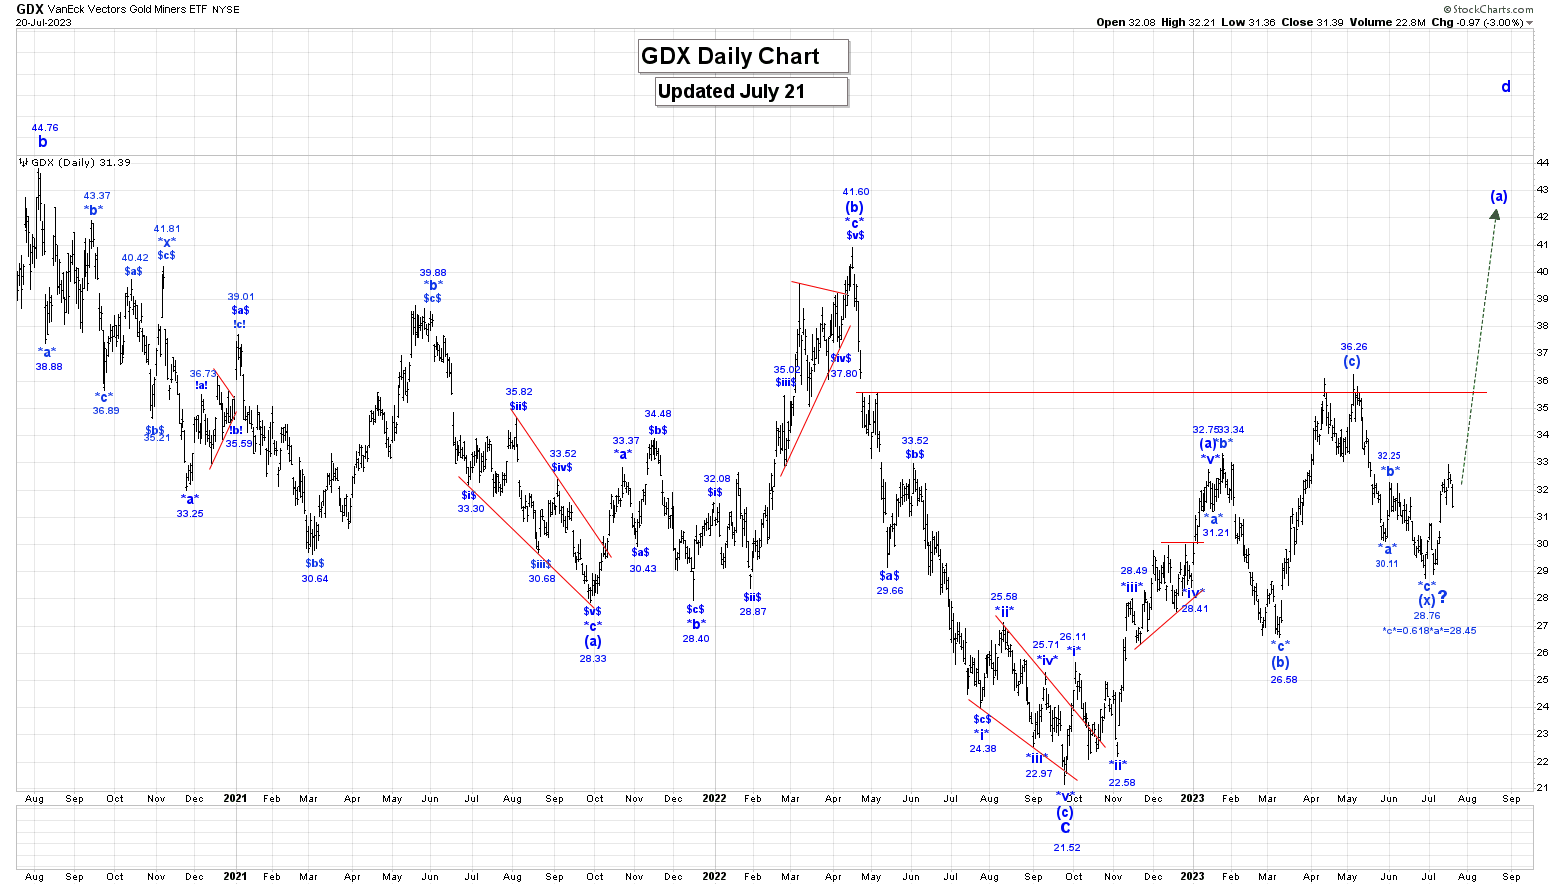
The GDX was lower in yesterday’s trading session reaching a low of 31.36, closing at 31.39.
Our long-term count for the GDX now suggests that wave B has become a bullish triangle. In this count all of wave A ended at the 53.07 high in 2008 and all of wave c of triangle B is complete at the 21.52 low.
We continue to rally in a more complex wave d.
Wave is becoming more complex and likely a double 3 wave pattern. Our first 3 wave pattern ran from 21.52 to 36.26, and we are now falling in a wave (x).
Within wave (x) it now looks like wave *a* ended at 30.11 and wave *b* at 32.25 and it now looks like all of wave *c* is complete at the 28.76 low. We should now be starting to rally higher in our second wave (a).
Next major resistance is the 33.06 level.
Ideally, we would like to see wave d rally to at least the red down trendline connecting 45.78 and 41.60, that is shown in our Weekly GDX Chart. This would be around the 39.00 level.
Wave d cannot trade above our wave b high of 45.78, for our larger wave B triangle formation to remain valid.
There is an outside chance that all of wave d ended at the 36.26 high and all of wave e ended at the 28.76 low. This would suggest that all of our wave B bullish triangle ended at the 28.76 low and that we have started to thrust higher in wave C.
This will be our alternate count.
Kinross (Updated April 17th, 2023):
Wave A ended at 31.88 in 1996, and since that high was made, we have been working on a bullish wave B triangle formation that looks like:
a = 1.12;
b = 27.40;
c = 1.31;
d is now underway;
e drop after wave d ends to complete all of wave B.
Wave d looks to have become a complex series of 3 wave patterns, with our first pattern running from 1.31 to 10.32. We have just completed our first wave (x) at the 3.00 low. We should now be starting our second 3 wave pattern, as shown on our Monthly Chart.
We anticipated that our second wave (a) will take several more months to develop.
Wave d cannot rally above the wave b high of 27.40, for this current wave B triangle formation to remain valid.
ABX (Updated January 03rd, 2023):
Wave A was a 3-wave rally that ended at 54.43 in 2008 and we are currently working on a wave B bullish triangle. Within that triangle we have completed waves a, b and c as follows:
a = 5.81;
b = 30.69;
c = 13.01.
We are now starting to ally in wave d, which cannot rally above the wave b high of 30.69, for this triangle option to remain valid. Wave d must consist of at least one 3 wave pattern, but can have up to three such patterns, before it ends. Now we do not know which internal wave pattern wave d will consist of. After wave d ends, we expect a wave e drop to complete all of the wave B bullish triangle.
After wave B ends, we expect a very sharp thrust higher in wave C.
HUI (Updated April 13th, 2023):
Wave A ended at 519.61 in 2008, and it looks like all of wave B has become a bullish triangle with the following endpoints:
(a) = 99.19;
(b) = 373.85;
(c) = 172.86:
(d) rally is now underway;
(e) drop after wave (d) ends to complete all of the wave B bullish triangle.
Within wave (d) it looks like wave a ended at 267.35 and wave b at 210.09, so we are now rallying in wave c, which has a projected endpoint of:
c = 1.618a = 362.97.
Wave (d) cannot rally above the wave (b) high of 373.85, for our current wave B triangle formation to remain valid.
After wave B ends, we expect a sharp thrust higher in C to all time new highs for this market.
XAU (Updated April 13th, 2023):
Wave B ended at the 38.37 low in 2016 and we are now rallying in a long-term wave C. Within wave C , we completed wave i at 101.76 and all of a complex wave ii at 60.59. We are now rallying in wave iii, which that following projected endpoint:
iii = 4.236i = 329.11.
Within wave iii, we believe that wave (i) ended at 167.09 and wave (ii) at 90.08. We are now rallying in wave (iii), which ahs an initial projcted endpoint of:
(iii) = 1.618(i) = 262.40.
Within wave (iii), it looks like wave -i- ended at 139.37 and wave -ii- at 110.09, and we are now rallying in wave -iii-, which has an initial projcted endpoint of:
-iii- = 1.618-i- = 189.84
We expect higher prices in the months ahead as we continue to rally higher in wave -iii- of (iii).
SSR Mining (Updated January 09th, 2023):
Wave A ended at 48.16 in 2007, and since that high was made, we have been working on a bullish wave B triangle formation that has the following make-up, so far:
a = 3.66;
b = 25.32;
c = 15.01;
d rally is now underway;
e drop after wave d ends.
Wave d cannot rally above the wave b high of 25.32 for this current bullish triangle formation to remain valid. After wave d ends, we expect a wave e drop that will complete this multi-year bullish triangle.
Newmont Mining: (Updated January 13th, 2023):
Newmont Mining is following a rather complex Ewave pattern, as we are currently working on a double 3 wave pattern, likely all within a larger multi-decade wave (A). Within the wave (A), we completed our first 3 ABC pattern in 1996 at 79.83, which was followed by a wave X drop to 12.44. After wave X ended, we are now rallying in our second ABC pattern, with wave A ending at 61.19 and wave B at 15.02. We are now rallying in wave C and within wave C we are now rallying in wave iii, which has an initial projected endpoint of:
iii = 2.618i = 106.71.
Within wave iii, we completed wave (ii) at 37.45 and we are now rallying in wave (iii), which has initial projected endpoint of:
(iii) = 1.618(i) = 131.33.
Longer term our current projected endpoint for our second wave C is:
C = 2.618A = 142.65.
Trading Recommendation: Long Term hold of all gold stocks and indices.
Active Positions: We remain long the GDX, ABX, KGC, NEM, SSRM, and TSX:XGD with no stops!!
Gold:
Daily Gold Chart:
https://captainewave.com/wp-content/uploads/2023/07/ewjul2123gold.png
Short Term Update:
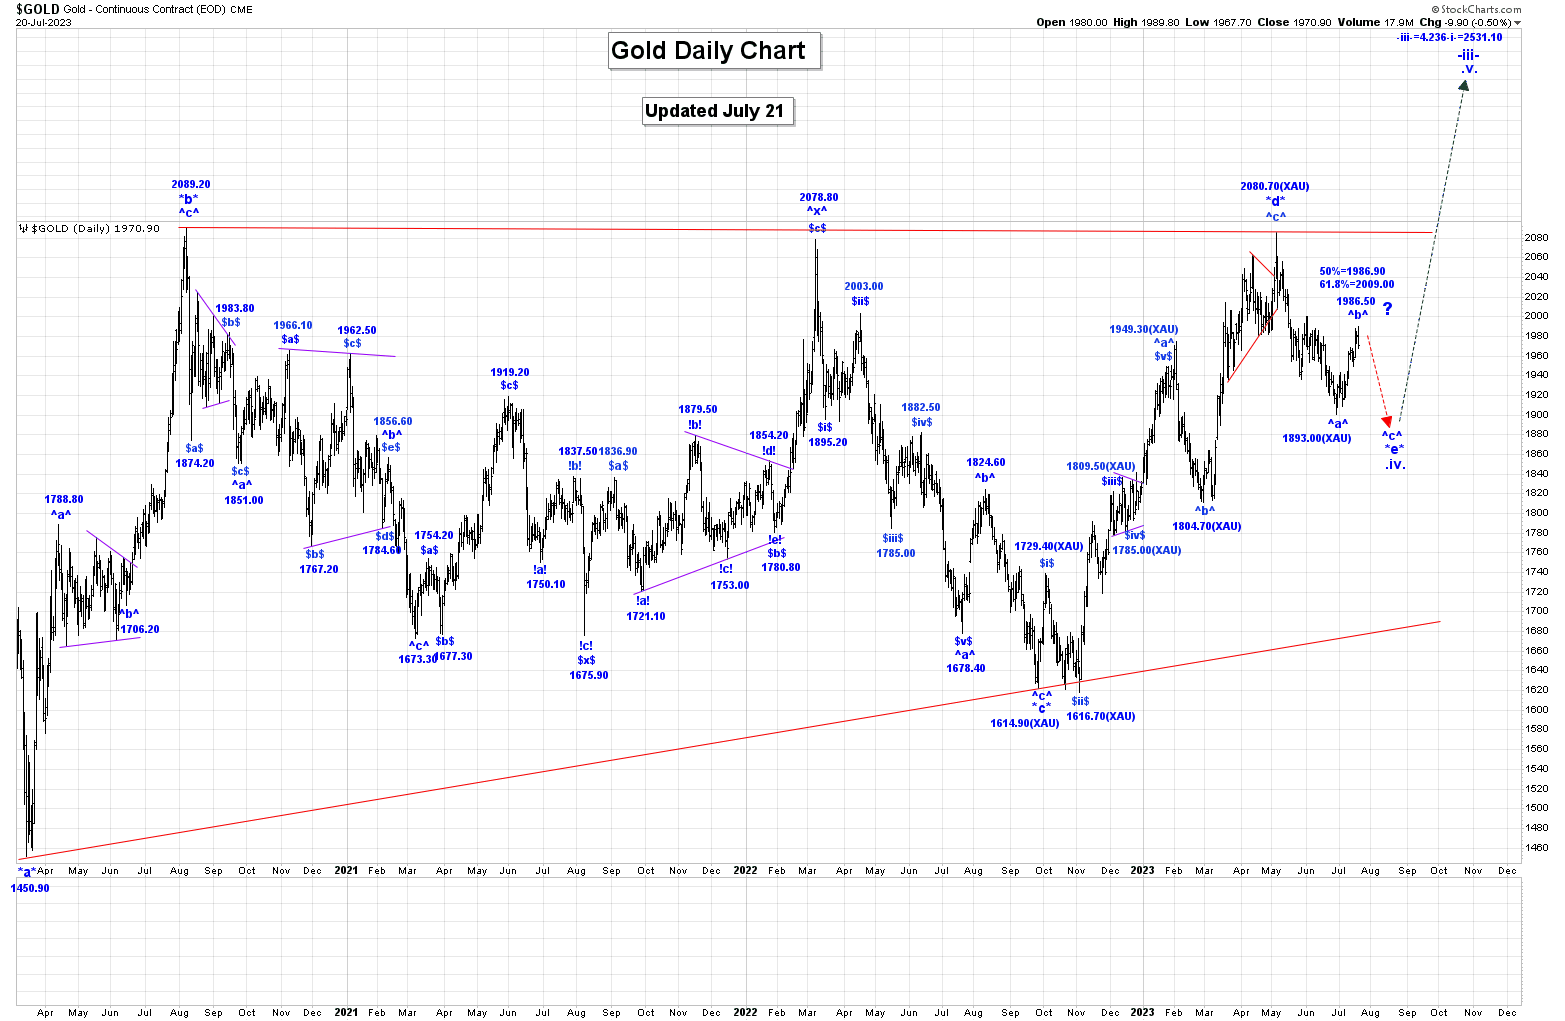
Gold was lower in yesterday’s day session and that trend lower has continued in the overnight session as we have reached a low of 1961.10.
We are using the symbol XAU/USD for our current gold pricing analysis.
Wave *d* ended at the 2080.70 spike high and we are now falling in wave *e*. We do not know which internal wave pattern wave *e* will become but for the moment will assume that is it is a simple 3 wave pattern.
We are now working on the assumption that all of wave ^a^ is complete at the 1893.00 low and that we have started to rally higher in wave ^b^. Our projections for the end of wave ^b^ are:
50% = 1986.90;
61.8% = 2009.00.
We have reached our 50% retracement level (1987.50) for wave ^b^, so we need to be on guard for its potential completion, and that start of another drop in wave ^c^, although it is still possible that we could move higher to the 61.8% retracement level, before all of wave ^b^ ends.
The drop in wave ^c^ back to at least the wave ^a^ low of 1893.00 will complete all of wave *e* and all of the very large bullish wave .iv. triangle.
We did have a key daily reversal lower in yesterday’s trading session which may have marked the end of wave ^b^ at the 1987.50 high.
On the Intraday Chart our alternate bullish triangle option, which started at the 1963.90, still remains valid although it has expanded and extended. The legs of our potential bullish triangle look like:
!a! = 1945.90;
!b! = 1987.50;
!c! = 1961.10, if complete and we cannot fall below the 1945.90 low;
!d! is now underway and we cannot rally above the 1987.60 high;
!e! after wave !d! ends, which cannot trade below the wave !c! low, to complete all of this bullish triangle.
There is still an outside that chance that the recent drop could be all of wave *e* and not just wave ^a^ of *e* and in this case our wave .iv. bullish triangle is complete at the 1893.00 low and that we have started to thrust sharpy higher in wave .v. of -iii-.
Wave *e* can fall as low as the wave *c* low of 1614.90 and our bullish triangle formation will remain valid.
Wave *e* could also become a bullish triangle.
Our current projected target for the end of wave -iii- is:
-iii- = 4.236-i- = 2531.10.
Trading Recommendation: Go Long gold. Use puts as stops.
Active Positions: Long gold, with puts as stops!
Silver:
Daily Silver Chart:
https://captainewave.com/wp-content/uploads/2023/07/ewjul2123si.png
Short Term Update:
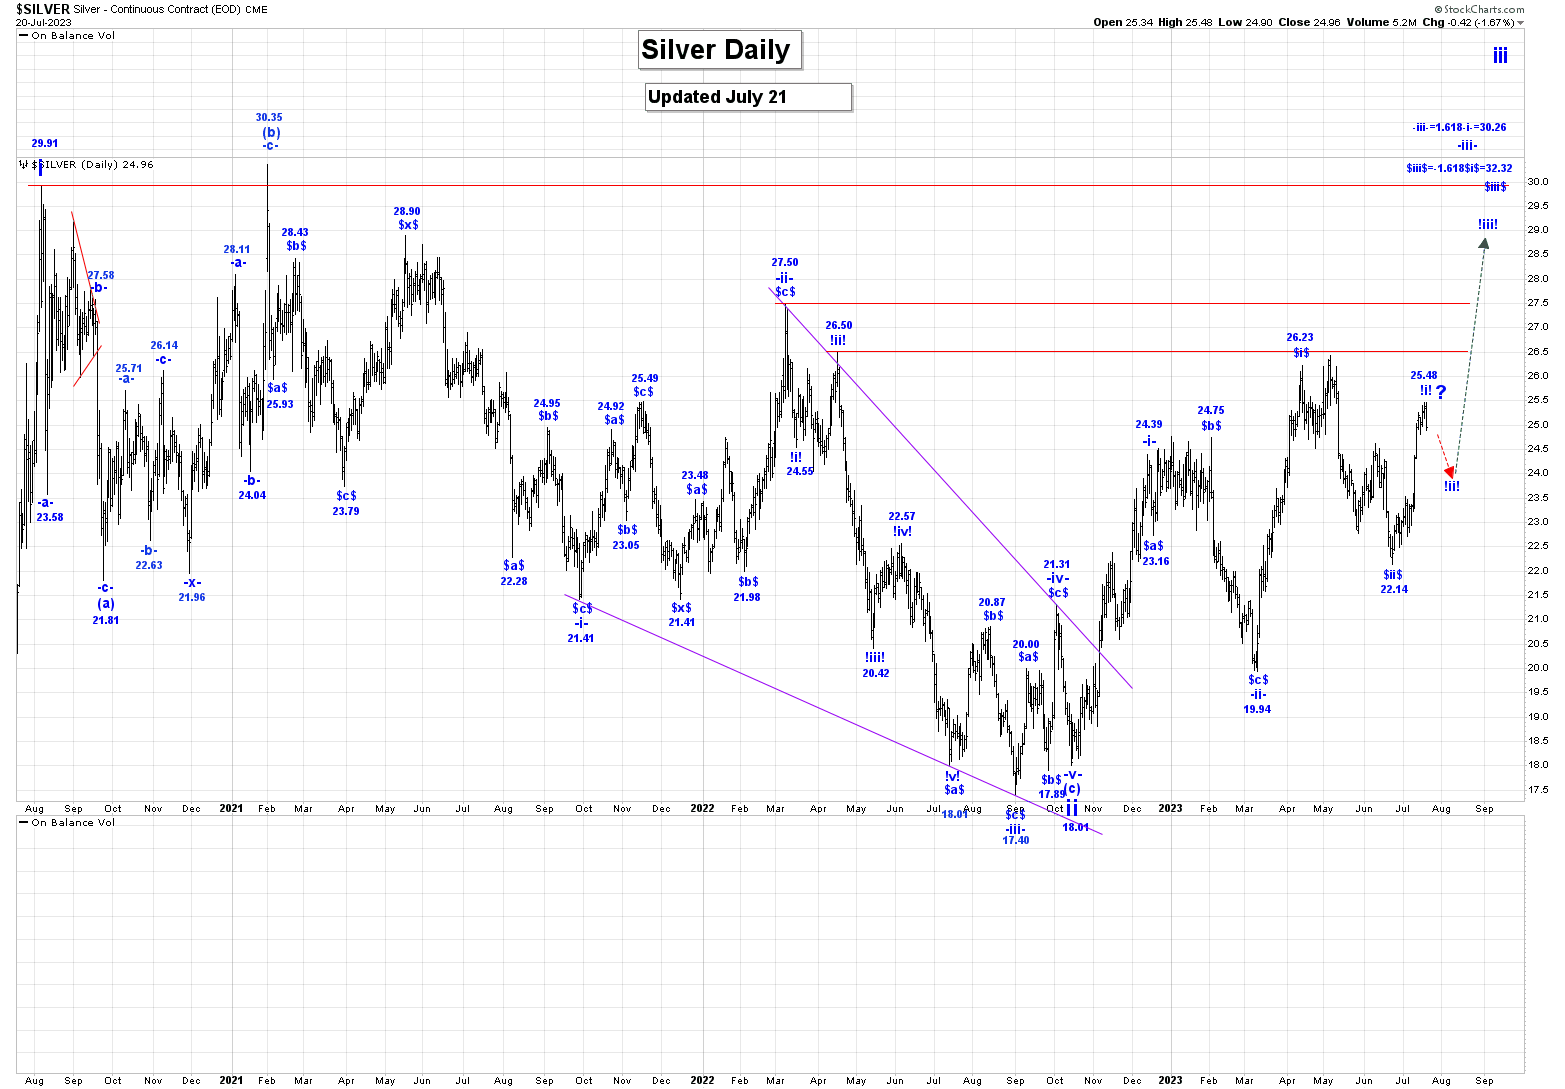
Silver was lower in yesterday’s day session and that trend lower has continued in the overnight session as we have reached a low of 24.85.
We are now rallying in wave iii, and within wave iii, all of wave -i- of (i) ended at the 24.39 high and wave -ii- at the 19.94 low. We are now rallying in wave -iii-, which has an initial projected endpoint of:
-iii- = 1.618-i- = 30.26.
Wave $ii$ is complete at the 22.14 low and we are now rallying in wave $ii$, which ash the following initial endpoint:
$iii$ = 1.618$i$ = 32.32.
It looks like wave $iii$ is going to subdivide with wave !i! of $iii$ perhaps ending at the 25.48 high.
If that is the case then we should expect a wave !ii! drop that retraces between 50 to 61.8% of the entire wave !i! rally.
We also had a key daily reversal lower in silver which may have marked the end of wave !i! and the 25.48 high.
Longer term we still expect to move higher in wave $iii$ for the next couple of weeks to a month.
We will provide our retracement levels for wave !ii! in the next day or so.
Trading Recommendation: Go Long with puts as stops.
Active Positions: Long with puts as stops!
US 10 Year Bond Yield:
Daily US 10 Year Bond Yield Chart:
https://captainewave.com/wp-content/uploads/2023/07/ewjul2123bond.png
Short Term Update:
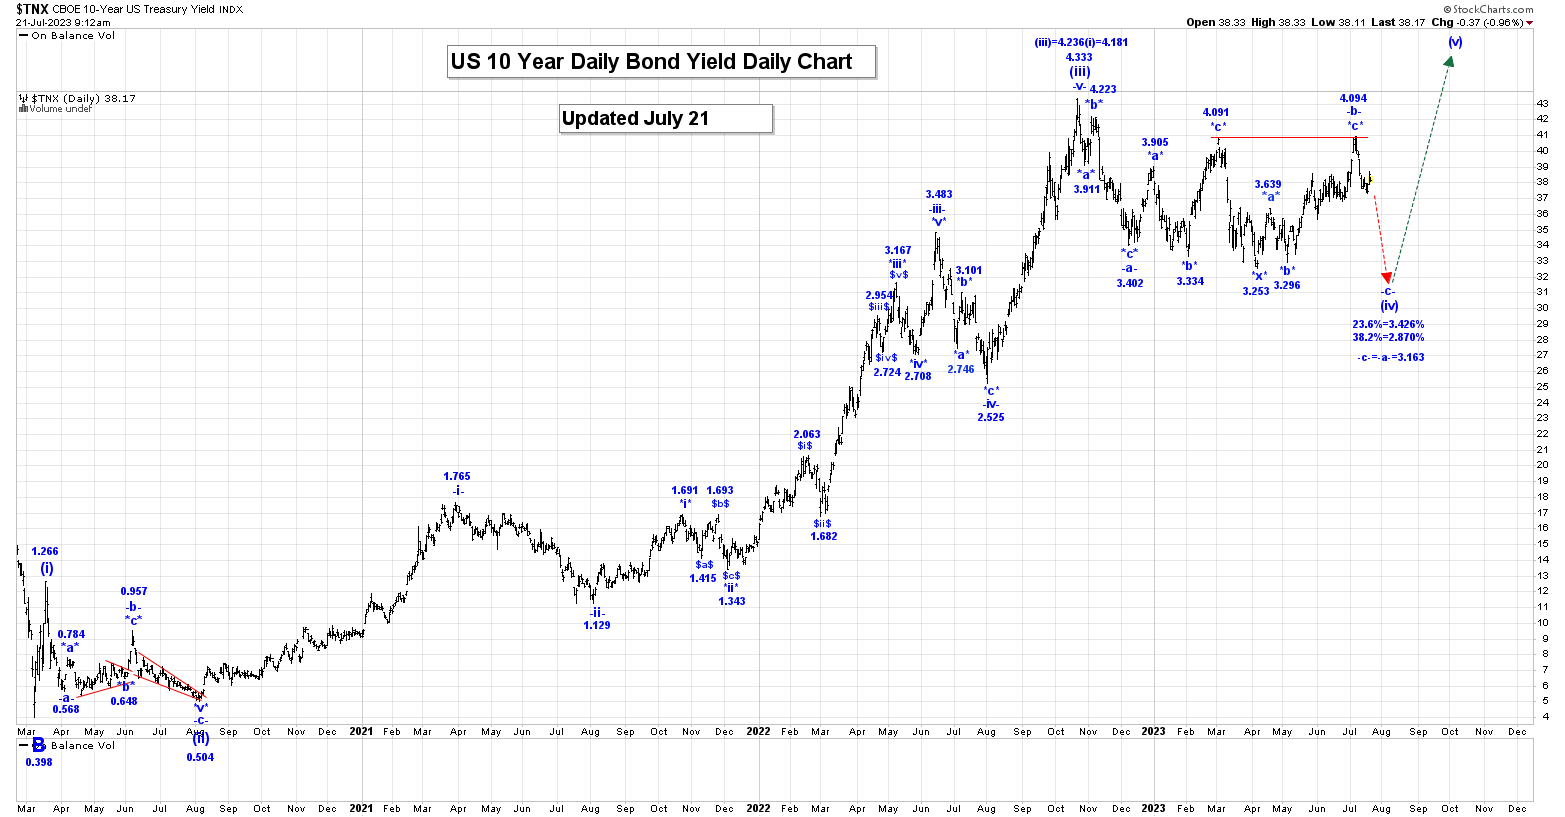
The US 10 Year Bond Yield was higher in yesterday’s day session reaching a high of 3.874%.
In the overnight session we have moved lower reaching a low of 3.835%!
All of wave (iii) is complete at the 4.333% high and we are still working on a complex wave (iv) correction, which has the following retracement levels:
23.6% = 3.426%;
38.2% = 2.870%.
We have updated our internal count for wave (iv) to suggest that we are working a 3 wave corrective pattern with wave -a- ending at 3.402%. Wave -b- has become double 3 wave pattern.
Our first 3 wave pattern ran from 3.402 to 4.091%, which was followed a wave *x* that ended at 3.253%. We are now rallying in our second 3 wave pattern, which is now complete at the 4.094% high.
We are now falling in wave -c-, which has a projected endpoint of:
-c- = -a- = 3.163%
We expect wave -c- will be an impulsive sequence and we likely completed our first wave down from 4.094 to 3.792%. We are now rallying in our first corrective wave which should retrace between 50 to 61.8% of the initial drop. Those retracement levels are:
50% = 3.943%;
61.8% = 3.979%.
We are still short of our 50% retracement level, so we should see further gains in the days ahead, before we turn down again.
After wave (iv) ends we expect another push higher in wave (v), which should at least reach the wave (iii) high of 4.333%.
Our current plan is to go long at the end of wave (iv).
Trading Recommendation: Flat.
Active Positions: Flat!
S&P500:
Daily SP500 Chart:
https://captainewave.com/wp-content/uploads/2023/07/ewjul2123spd.png
120 Minute SP500 Chart:
https://captainewave.com/wp-content/uploads/2023/07/ewjul2123sp120.png
Short Term Update:
The SP500 was lower in yesterday’s trading session as we reached a low of high of 4527.56.
In the overnight session the SP500 Futures are up by about 9 points.
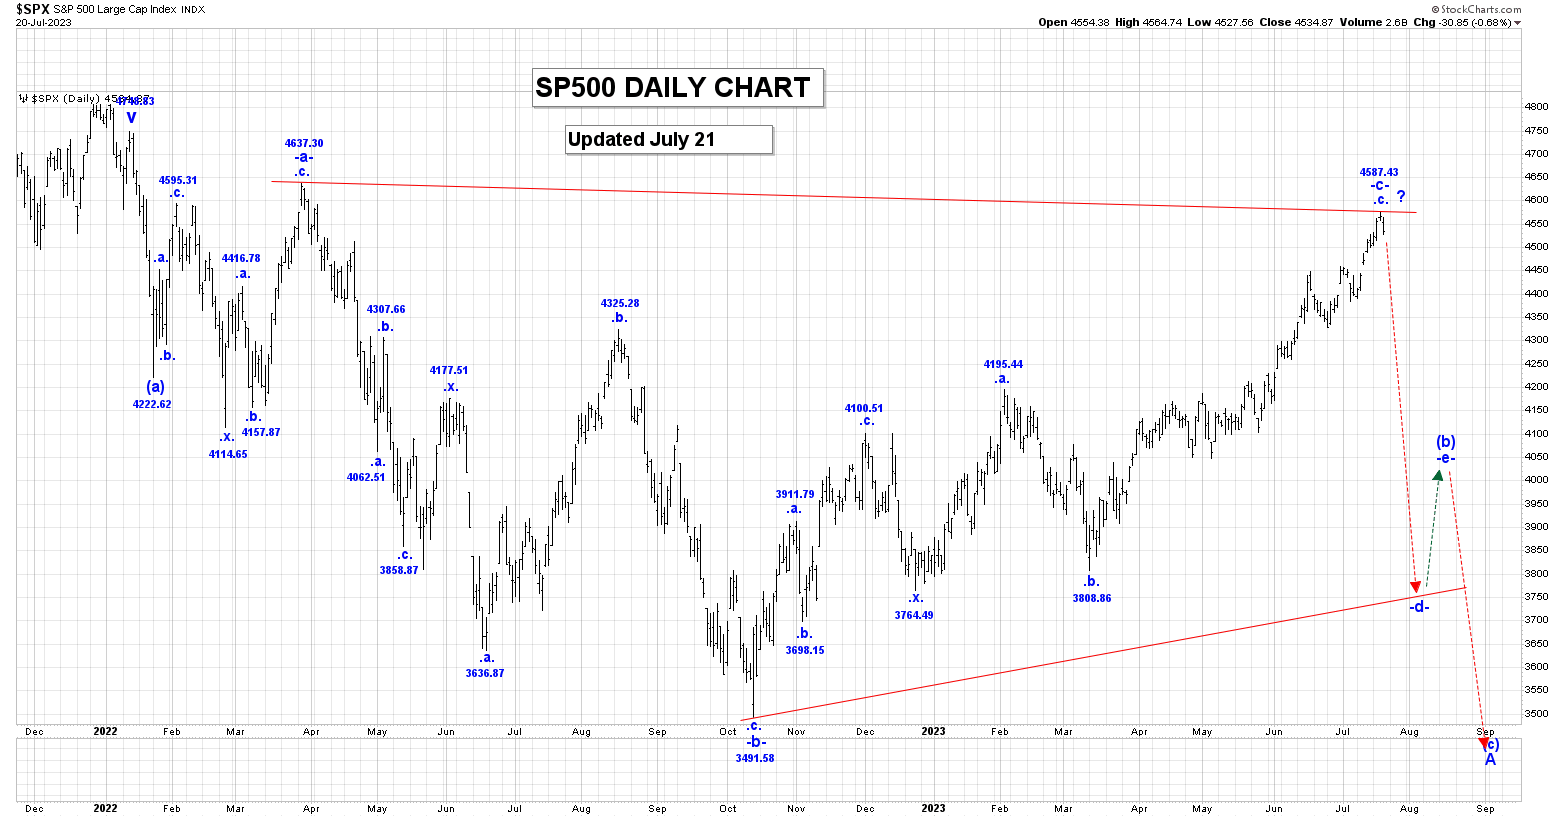
Wave v is complete at the 4748.87 high as a failure high. We have now started a multi-decade correction.
We have now updated our count to adopt our large bearish triangle option as shown on our Daily SP500 Chart. In general, we are falling in a 3-wave pattern, and within that pattern we are falling in wave A.
Within wave A, we completed wave (a) at 4222.62 and we are now working on an expanding and extending wave (b) bearish triangle. Within that triangle, wave -c- looks to still be underway as it has become more complex, and very, very overstretched now.
A major reversal is likely very near.
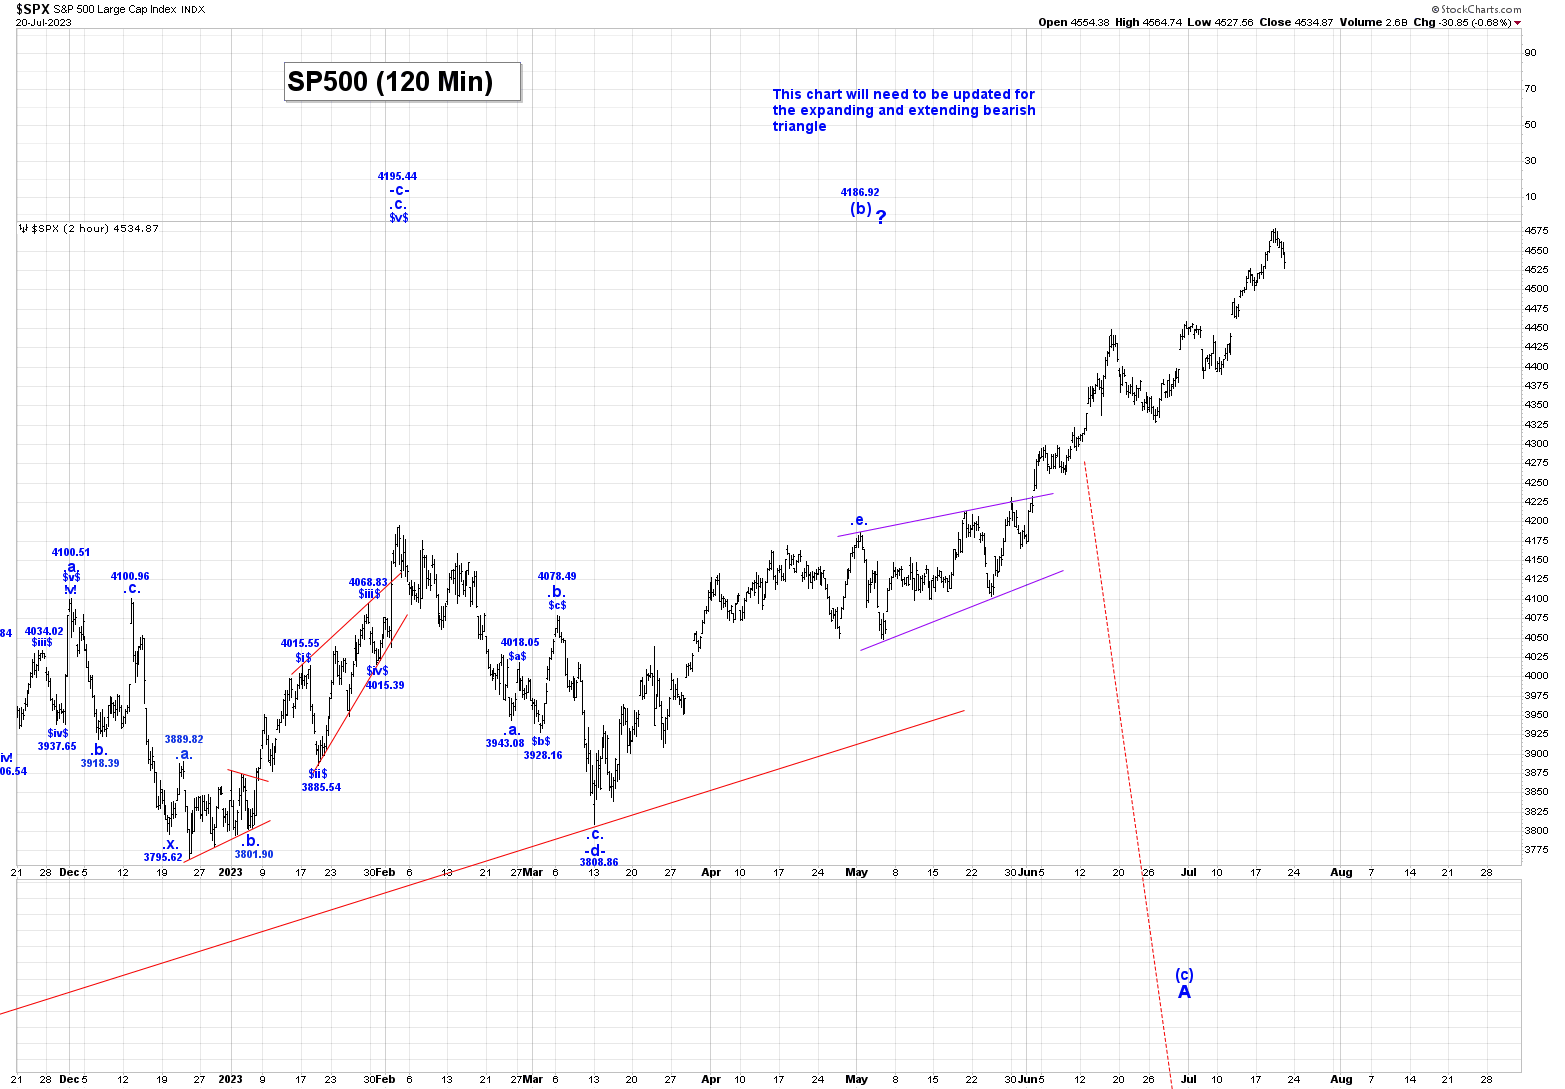
We are watching a potential ending diagonal triangle formation on the Daily SP500 Chart, which may be nearing completion.
After wave -c- ends we expect a wave -d- drop that will be followed by another wave -e- rally to complete the entire wave (b) bearish triangle formation. After our large wave (b) bearish triangle ends we expect a very large thrust lower in wave (c) to complete all of wave A.
We will need to update our 60 Min SP500 Chart to reflect our the expanding and extending bearish wave (b) triangle option.
Trading Recommendation: Go short with calls as stops.
Active Positions: Very short with calls as stops!
USDX:
Daily USDX Chart:
https://captainewave.com/wp-content/uploads/2023/07/ewjul2123usd.png
Short Term Update:
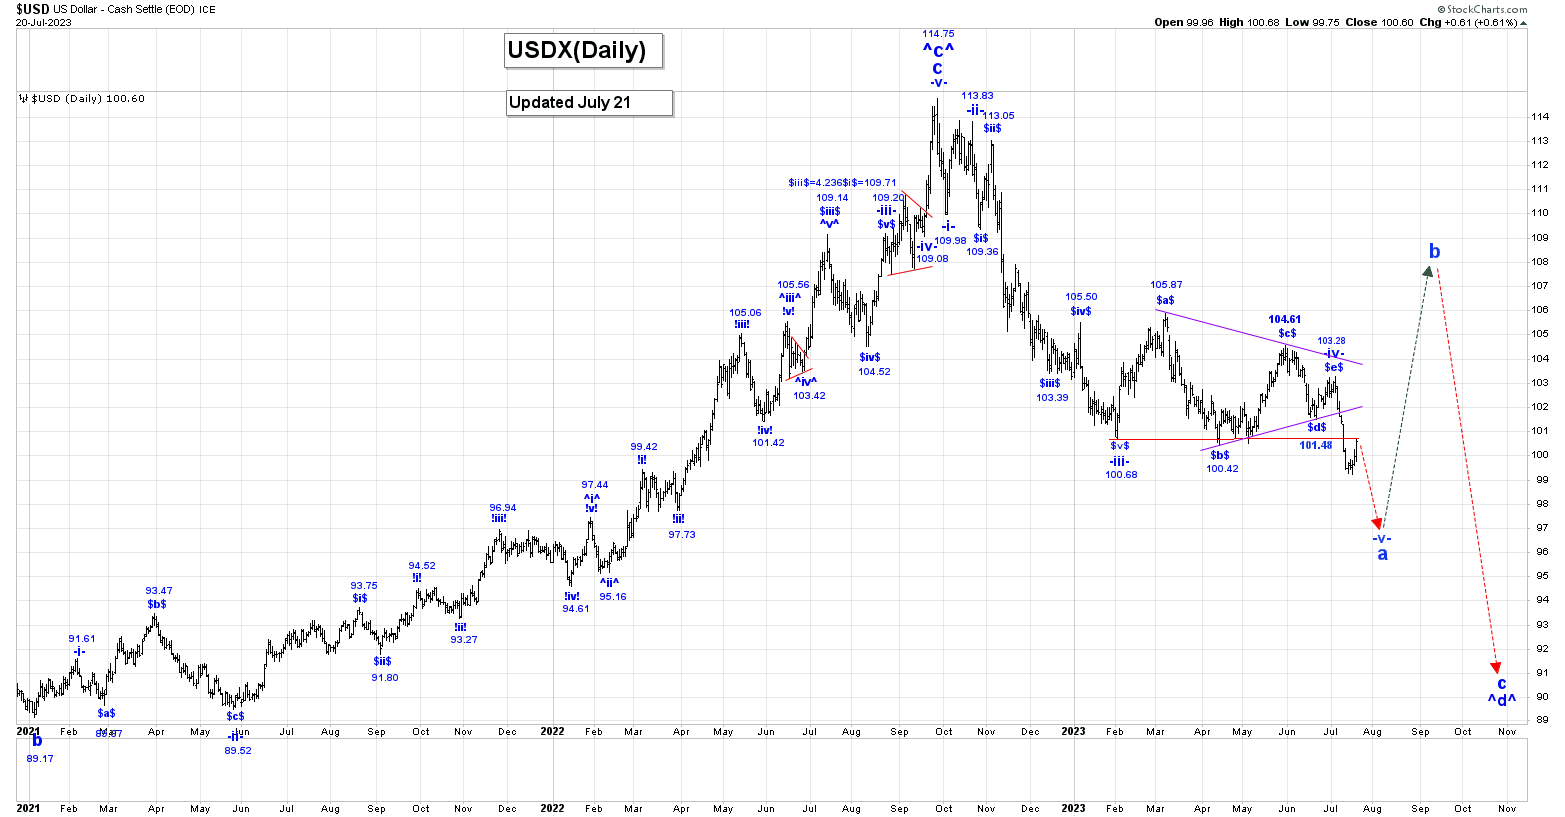
The USDX was higher in yesterday’s day session and that trend higher has continued in the overnight session as we have reached a high of 100.86.
All of wave ^c^ is complete at the 114.75 high and we are now falling in wave ^d^. The wave ^d^ drop must consist of at least one 3 wave pattern, so for the moment we will assume that we are falling in wave a of ^d^.
Our wave -iv- bearish triangle is complete at the 103.28 high, so we are now falling in wave -v- of a.
We should see further weakness over the next couple of weeks to a month as wave -v- unfolds, although it could now be possible that all of wave -v- and wave a are complete at the 99.22 low.
If that is the case then we are starting to rally sharply higher in wave b. the other option is that wave -v- is still underway and we are just correcting the drop from 103.28 to 99.22, with those retracement levels being:
50% = 101.26;
61.8% = 101.73.
Our preferred option is that wave -v- and a are still underway.
Trading Recommendation: Flat.
Active Positions: Flat!
Crude Oil:
Daily Crude Chart:
https://captainewave.com/wp-content/uploads/2023/07/ewjul2123oil.png
Short Term Update:
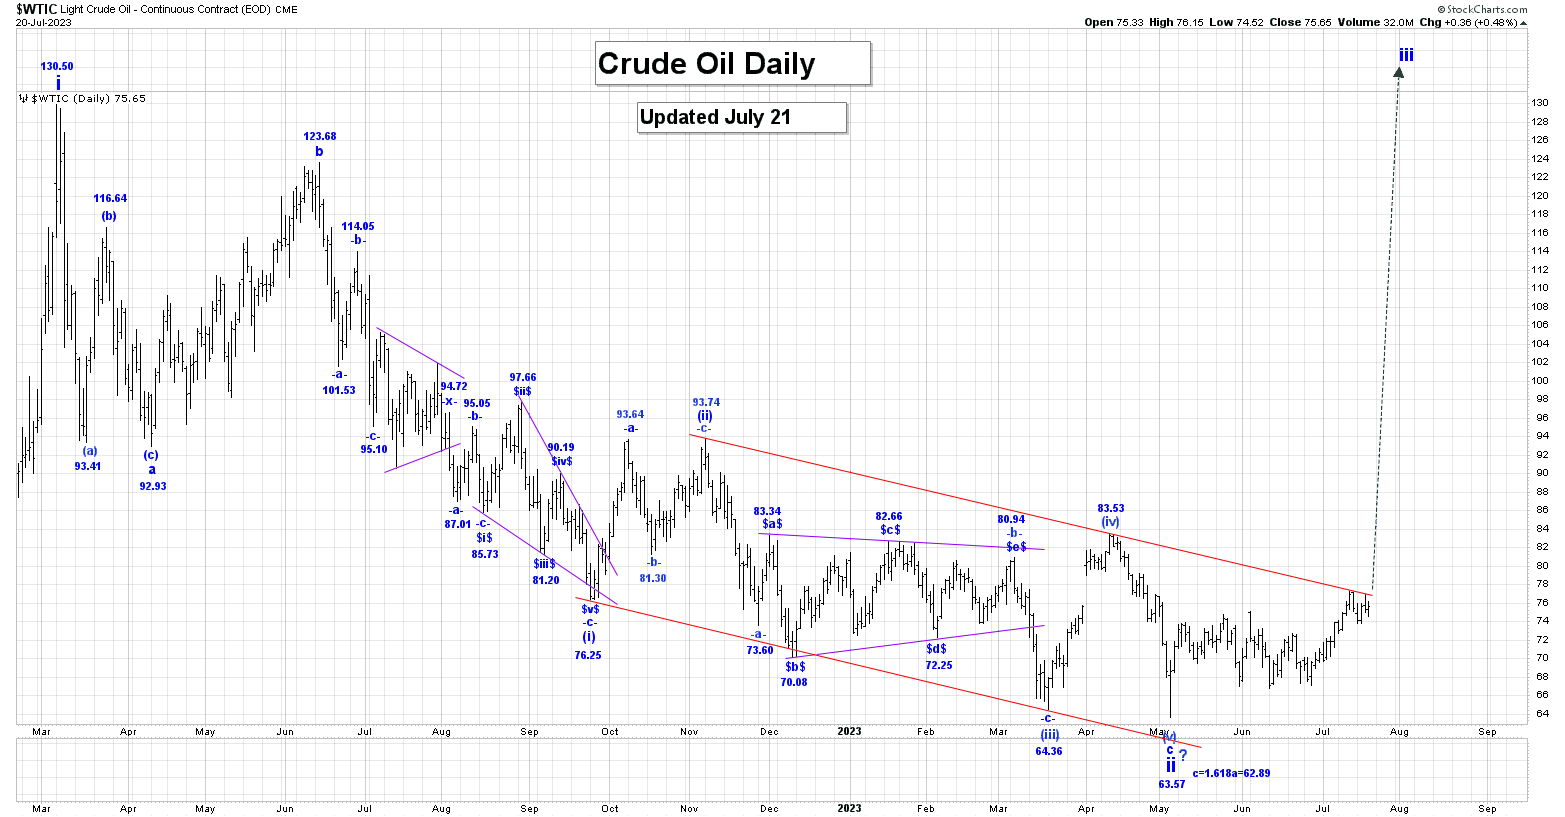
Crude was initially lower in yesterday’s day session reaching a low of 74.53, but after that low was made we moved higher and that trend higher has continued in the overnight session as we have reached a high of 76.74!
We have updated our internal wave count for wave ii as shown on our Daily Crude Chart.
It appears to be a very complex 3 wave corrective pattern with wave a ending at 92.93 and wave b at 123.68. Wave c had become a very complex ending diagonal triangle formation, which likely ended at the 63.57 spike low.
However only a break now of the wave (iv) of c high of 83.53 will confirm that. We do have a wave c projected endpoint of:
c = 1.618a = 62.89.
We cannot rule the possibility that this ending diagonal triangle could extend and expand.
Next resistance is the downtrend line connecting 93.74 and 83.53, which we are now again challenging, and a strong break and close above this line will confirm that all of wave ii is complete at the 63.57 low and that a sharp rally in wave iii is now underway.
Trading Recommendation: Go Long crude with a put as a stop. Long Suncor.
Active Positions: Long crude with puts as a stop! Long Suncor!
Thanks!
Captain & Crew