Captain Ewave Morning Post!
Please click here for the Bob Balan Ewave Basics Handbook… which the Captain highly recommends:
https://captainewave.com/wp-content/uploads/2021/04/Ewave-Basics.pdf
Don’t try to learn Ewave all in one day. Focus on when the Captain is buying or selling, and the big wave counts.
From there, add more detail to your study.
If any sub needs one-on-one help with the wave counts, just some handholding during market dips, or both, shoot us an Email we’ll work out a phone talk time slot. Can buy a one-time slot or multi… Thanks, Captain & Crew
CDNX:
CDNX Chart:
https://captainewave.com/wp-content/uploads/2023/02/ewfeb623cdnx.png
Short Term Update:
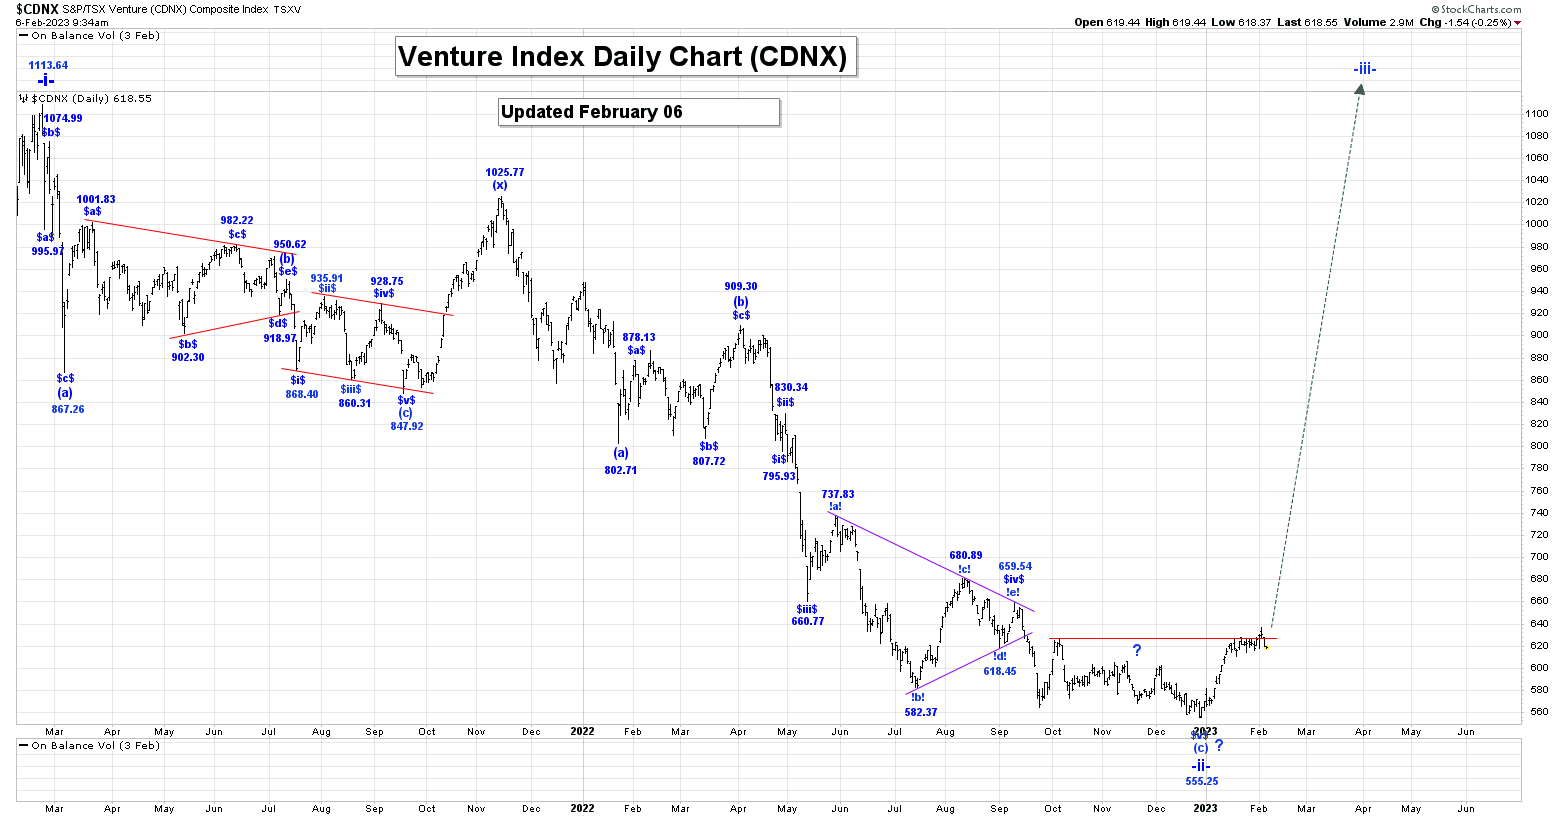
The CDNX was lower in Friday’s trading session reaching a low of 619.68, closing at 620.09!
We have broken above the 625.99 high, which has eliminated our ending diagonal triangle formation for wave $v$. This suggests that all of wave -ii- is complete at the 555.25 low, although we are currently not sure what our internal count for wave $v$ of (c) of -ii- looks like. We will need to take another look at what is going on.
In the meantime, we are now working on the assumption that all of wave -ii- is complete at the 555.25 low and that we have started to rally sharply higher in wave -iii-.
Next resistance is the 625.99 level, which we are still trying to break through.
Trading Recommendation: Go Long the GDXJ as a long-term hold.
Active Positions: Heavily long the GDXJ and key juniors on the CDNX, as a long-term hold!
GDX & Gold Stocks:
GDX 60 Min Chart:
https://captainewave.com/wp-content/uploads/2023/02/ewfeb623gdx60.png
GDX Daily Chart:
https://captainewave.com/wp-content/uploads/2023/02/ewfeb623gdxd.png
Short Term Update:
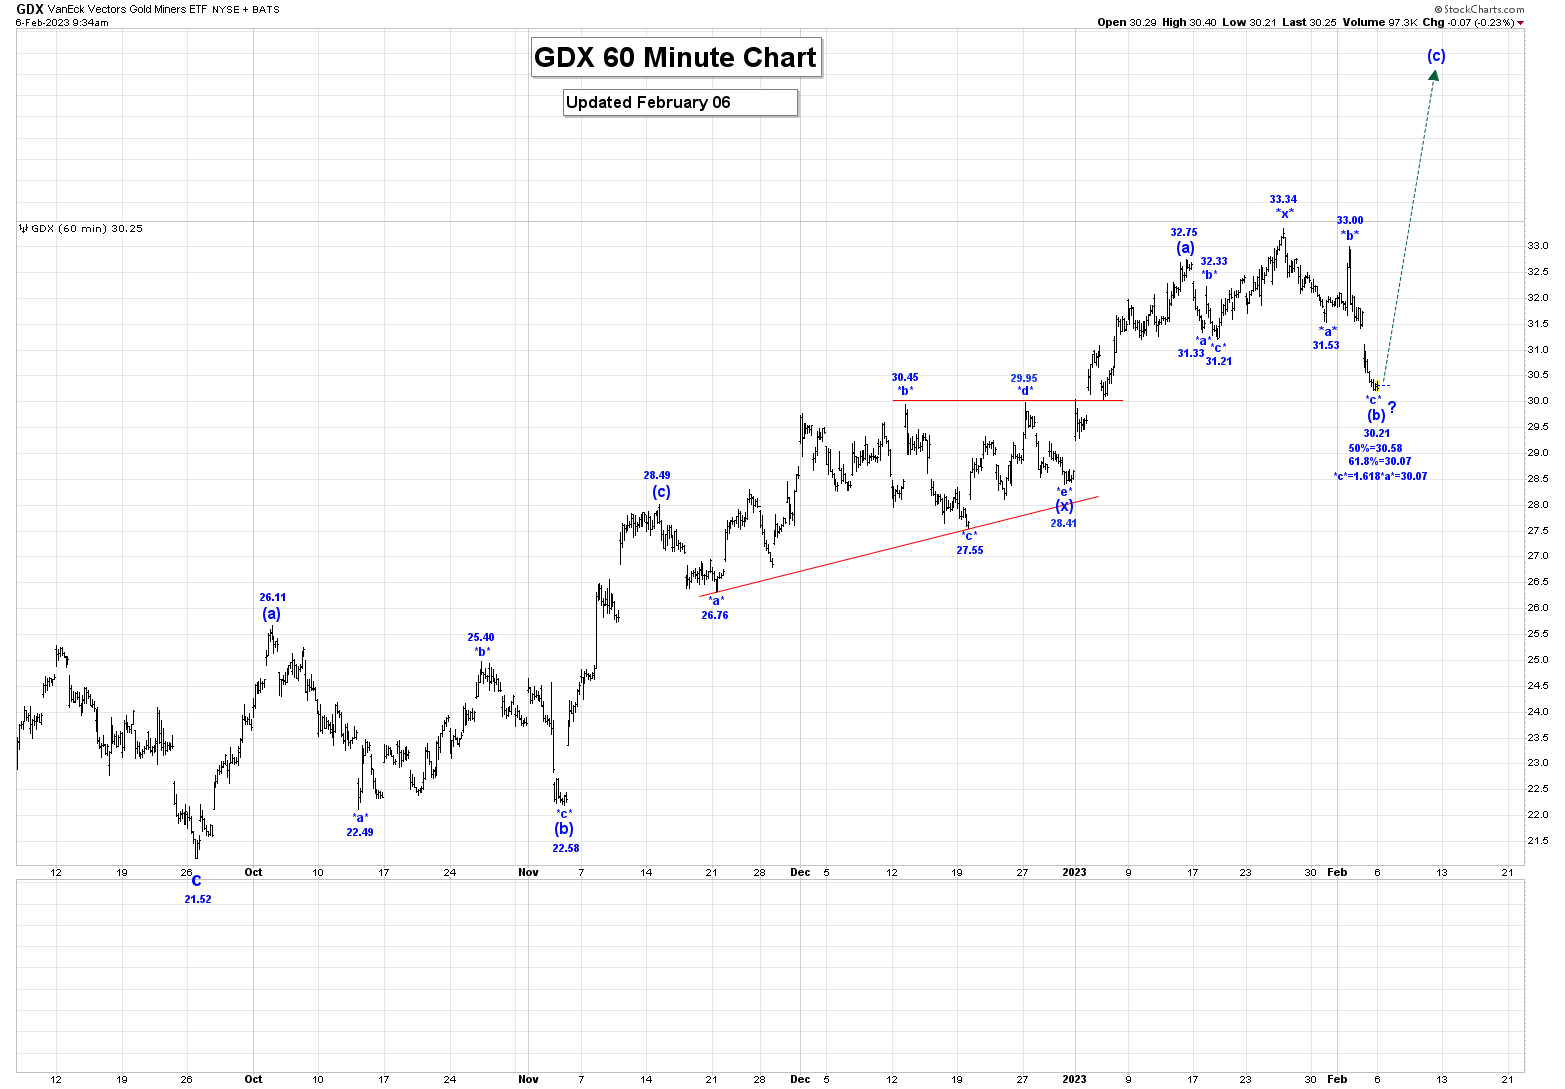
The GDX was sharply lower in Friday’s trading session reaching a low of 30.21, closing at 30.32!
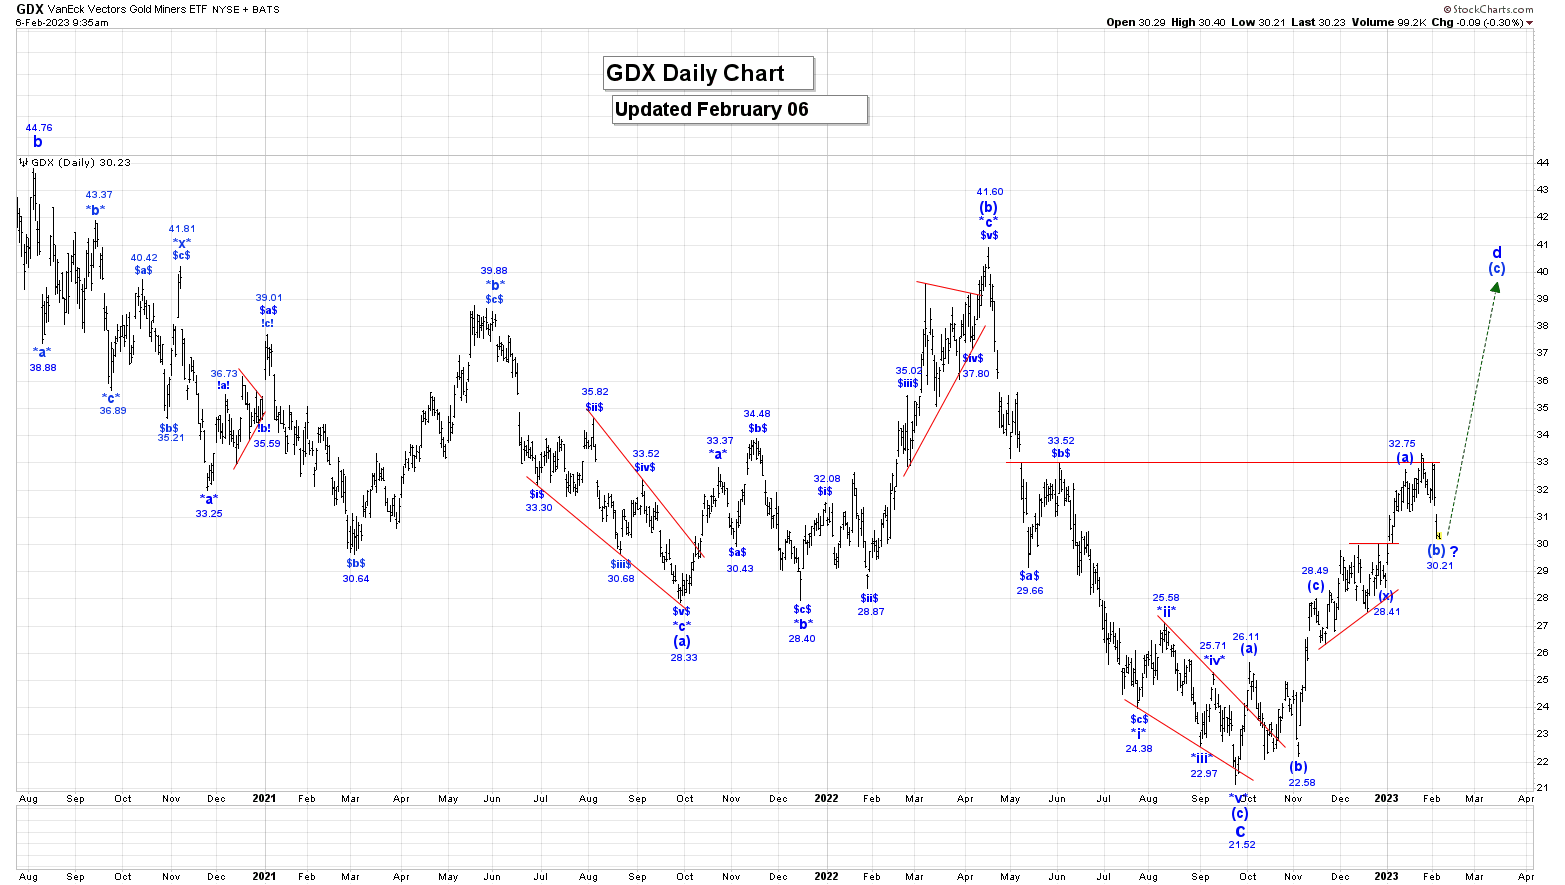
Our long-term count for the GDX now suggests that wave B has become a bullish triangle. In this count all of wave A ended at the 53.07 high in 2008 and all of wave c of triangle B is complete at the 21.52 low. We are now rallying in wave d.
It now looks like wave d has become a double 3 wave rally as shown on our Daily and 60 Min GDX Charts. The first 3 wave rally ran from the wave c low of 21.52 to 28.49 and was followed by a wave (x) bullish triangle. We think within our second 3 wave rally that wave (a) ended at 32.75 and if that is the case then we are now falling in our second wave (b) which has retracement levels as follows:
50% = 30.58;
61.8% = 30.07.
It looks like our second wave (b) also consists of a double 3 wave corrective pattern, with our second wave *c* having a projected endpoint of:
*c* = 1.618*a* = 30.07.
We have now entered our retracement zone, so we need to be on guard for the completion of our second wave (b) and the start of another rally in our second wave (c). After this second wave (c) rally ends we think this will complete all of wave d.
No matter how complex wave d becomes it cannot trade above our wave b high of 45.78, for our larger wave B triangle formation to remain valid.
Kinross (Updated January 04th, 2023):
Wave A ended at 31.88 in 1996, and since that high was made, we have been working on a bullish wave B triangle formation that looks like:
a = 1.12;
b = 27.40;
c = 1.31;
d is now underway;
e drop after wave d ends to complete all of wave B.
Wave d looks to have become a complex series of 3 wave patterns, with our first pattern running from 1.31 to 10.32. We have just completed our first wave (x) at the 3.00 low. We should now be starting our second 3 wave pattern, as shown on our Monthly Chart.
We anticipated that our second wave (a) will take several months to develop.
Wave d cannot rally above the wave b high of 27.40, for this current wave B triangle formation to remain valid.
ABX (Updated January 03rd, 2023):
Wave A was a 3-wave rally that ended at 54.43 in 2008 and we are currently working on a wave B bullish triangle. Within that triangle we have completed waves a, b and c as follows:
a = 5.81;
b = 30.69;
c = 13.01.
We are now starting to ally in wave d, which cannot rally above the wave b high of 30.69, for this triangle option to remain valid. Wave d must consist of at least one 3 wave pattern, but can have up to three such patterns, before it ends. Now we do not know which internal wave pattern wave d will consist of. After wave d ends, we expect a wave e drop to complete all of the wave B bullish triangle.
After wave B ends, we expect a very sharp thrust higher in wave C.
HUI (Updated January 06th, 2023):
Wave A ended at 519.61 in 2008, and it looks like all of wave B has become a bullish triangle with the following endpoints:
(a) = 99.19;
(b) = 373.85;
(c) =172.86:
(d) rally is now underway;
(e) drop after wave (d) ends to complete all of the wave B bullish triangle.
Wave (d) cannot rally above the wave (b) high of 373.85, for our current wave B triangle formation to remain valid.
After wave B ends, we expect a sharp thrust higher in C to all time new highs for this market.
XAU (Updated January 06th, 2023):
Wave B ended at the 38.37 low in 2016 and we are now rallying in a long-term wave C. Within wave C , we completed wave i at 101.76 and all of a complex wave ii at 60.59. We are now rallying in wave iii, which that following projected endpoint:
iii = 4.236i = 329.11.
Within wave iii, we believe that wave (i) ended at 167.09 and wave (ii) at 90.08. We are now rallying in wave (iii), which ahs an initial projcted endpoint of:
(iii) = 1.618(i) = 262.40.
We expect higher prices in the months ahead as we continue to rally higher in wave (iii).
SSR Mining (Updated January 09th, 2023):
Wave A ended at 48.16 in 2007, and since that high was made, we have been working on a bullish wave B triangle formation that has the following make-up, so far:
a = 3.66;
b = 25.32;
c = 15.01;
d rally is now underway;
e drop after wave d ends.
Wave d cannot rally above the wave b high of 25.32 for this current bullish triangle formation to remain valid. After wave d ends, we expect a wave e drop that will complete this multi-year bullish triangle.
Newmont Mining: (Updated January 13th, 2023):
Newmont Mining is following a rather complex Ewave pattern, as we are currently working on a double 3 wave pattern, likely all within a larger multi-decade wave (A). Within the wave (A), we completed our first 3 ABC pattern in 1996 at 79.83, which was followed by a wave X drop to 12.44. After wave X ended, we are now rallying in our second ABC pattern, with wave A ending at 61.19 and wave B at 15.02. We are now rallying in wave C and within wave C we are now rallying in wave iii, which has an initial projected endpoint of:
iii = 2.618i = 106.71.
Within wave iii, we completed wave (ii) at 37.45 and we are now rallying in wave (iii), which has initial projected endpoint of:
(iii) = 1.618(i) = 131.33.
Longer term our current projected endpoint for our second wave C is:
C = 2.618A = 142.65.
Trading Recommendation: Long Term hold of all gold stocks and indices.
Active Positions: We remain long the GDX, ABX, KGC, NEM, SSRM, and TSX:XGD with no stops!!
Gold:
Daily Gold Chart:
https://captainewave.com/wp-content/uploads/2023/02/ewfeb623gold.png
Short Term Update:
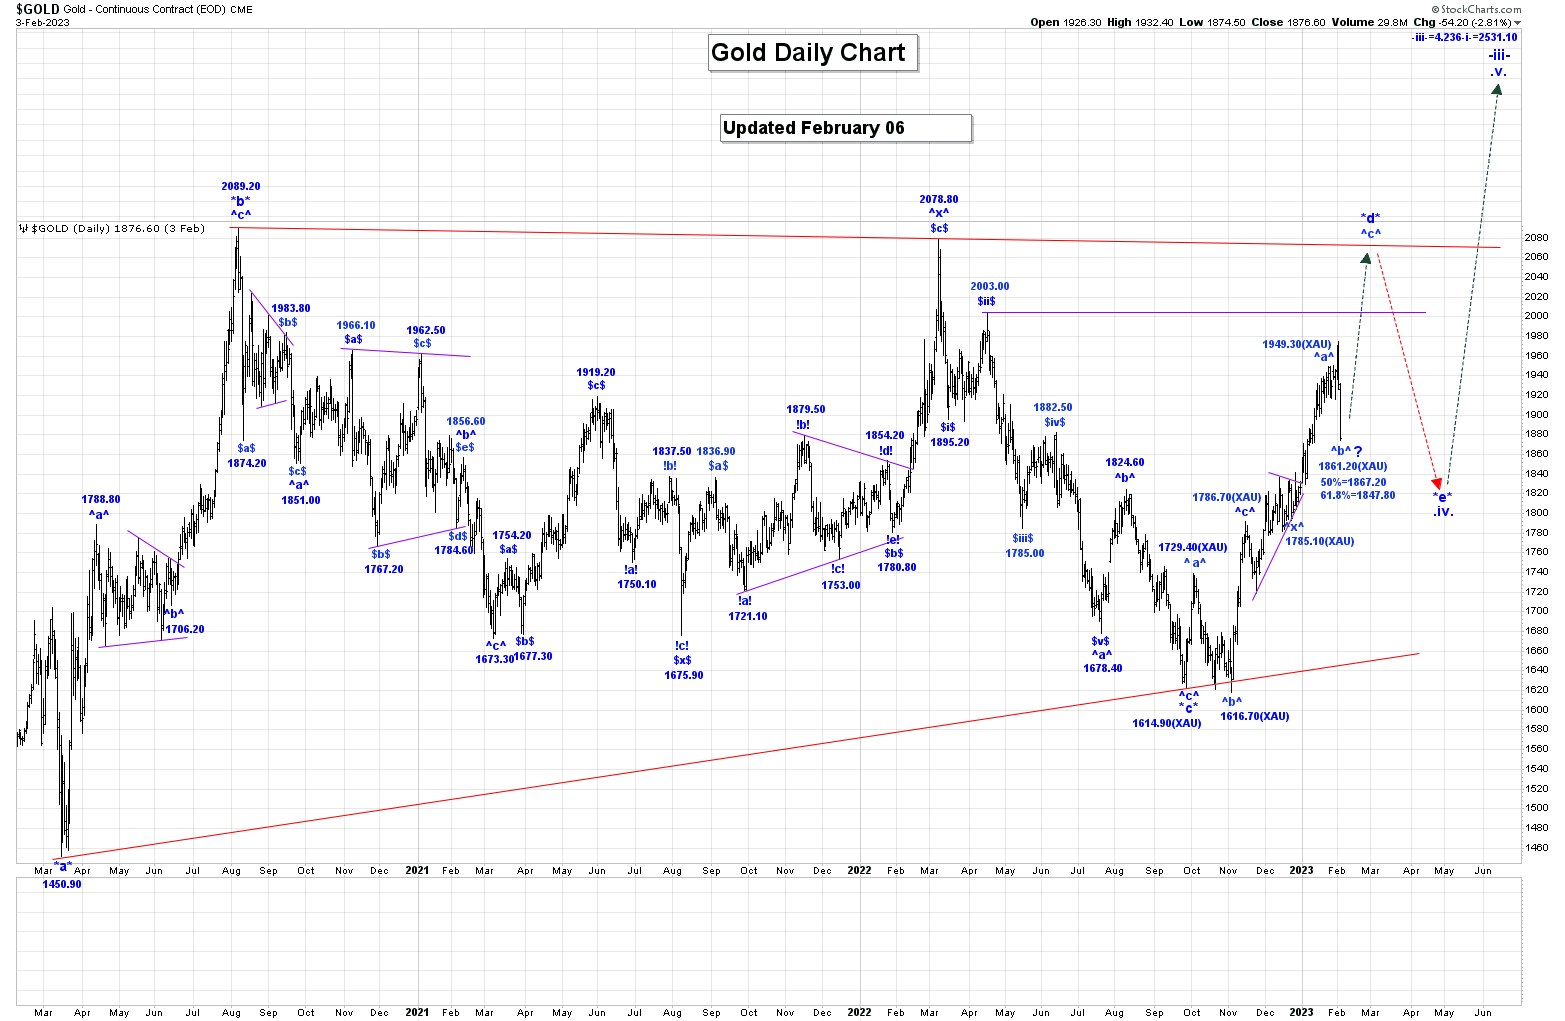
Gold was sharply lower in Friday’s day session and that trend lower has continued early in the overnight session as we have reached a low of 1861.20.
After that low was made, we moved higher reaching a high of 1881.30!
We are using the symbol XAU/USD for our current gold pricing analysis.
As indicated in our last Weekly Post we have revised the location of the end of wave *c* of our very large wave .iv. bullish triangle to 1614.90 (XAU). From that low we continue to rally in wave *d*, which now appears to have become a double 3 wave rally, as shown on our Daily Gold Chart.
From the wave *c* low of 1614.90 our first 3 wave pattern ran to 1786.70, and that was followed by a wave ^x^ bullish triangle that ended at 1785.10. Within our second 3 wave rally, wave ^a^ ended at 1949.30 and we are now falling in our second wave ^b^ that has a retracement level of:
50% = 1867.20;
61.8% = 1847.80.
We have now entered our retracement zone, so we need to be on guard for the completion of our second wave ^b^ and the start of another rally in wave ^c^. This next rally in our second wave ^c^ will likely complete all of wave *d*.
In the bigger picture, our wave *d* rally that cannot trade above our wave *b* high of 2089.20, and then after wave *d* ends we expect another drop in wave *e*, which cannot trade below the wave *c* of 1614.90. We have shown this graphically in our Daily Gold Chart.
Trading Recommendation: Long gold. Use puts as stops.
Active Positions: Long gold, with puts as stops!
Silver:
Daily Silver Chart:
https://captainewave.com/wp-content/uploads/2023/02/ewfeb623si.png
Short Term Update:
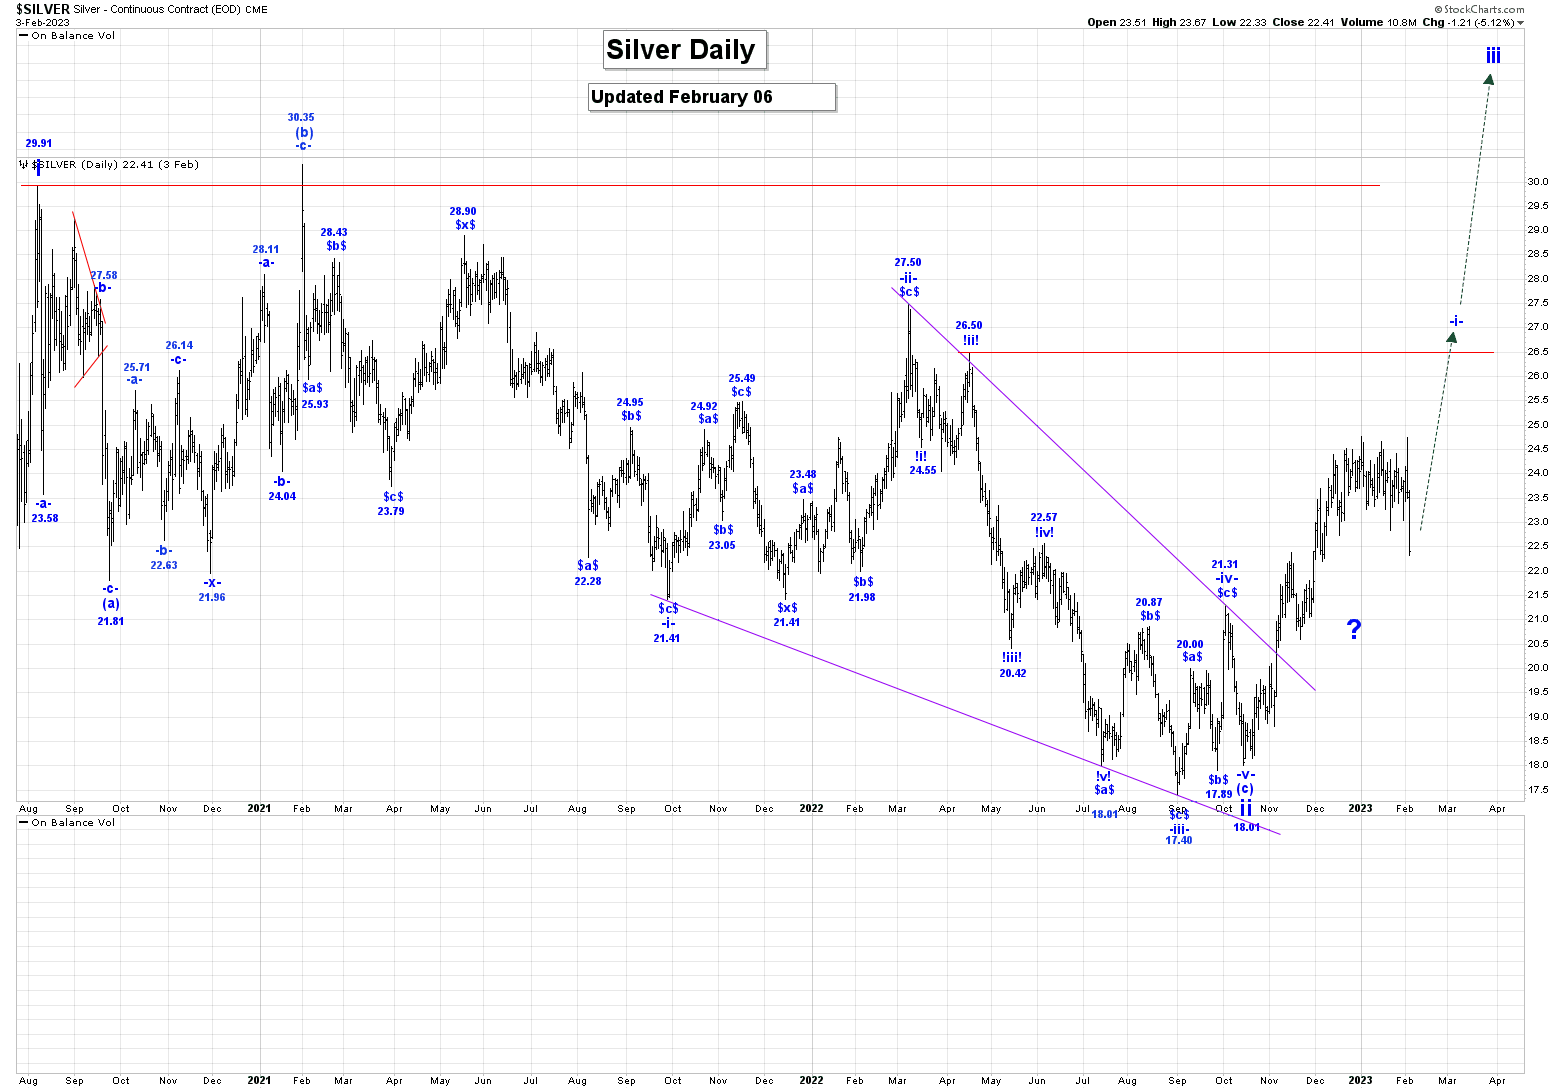
Silver was sharply lower in Friday’s day session and that trend lower continued early in the overnight session as we reached a low of 22.23. After that low was made, we moved higher reaching a high of 22.64!
We are now rallying in wave iii, and within wave iii, we are working on wave -i- of (i). Now we do have an internal wave structure to offer, so we will need to take a closer look over the next day or so.
Trading Recommendation: Go Long with puts as stops.
Active Positions: Long with puts as stops!
US 10 Year Bond Yield:
Daily US 10 Year Bond Yield Chart:
https://captainewave.com/wp-content/uploads/2023/02/ewfeb623bond.png
Short Term Update:
The US 10 Year Bond Yield was sharply higher in Friday’s day session and that trend higher has continued in the overnight session as we have reached a high of 3.616%!
All of wave (iii) is complete at the 4.333% high and we are now falling in wave (iv), which has the following retracement levels:
23.6% = 3.426%;
38.2% = 2.870%.
We are now waiting for confirmation at that all of wave (iv) is complete at the 3.334% low and if that is the case then we start to rally higher in wave (v). However, we still have lower projections for the end of wave -c- of (iv), as follows:
-c- = -a- = 2.974%;
-c- = 1.618-a- = 2.399%.
Wave (v) should see rates rally again to at least to the wave (iii) high of 4.333%.
Trading Recommendation: Flat.
Active Positions: Flat!
S&P500:
Daily SP500 Chart:
https://captainewave.com/wp-content/uploads/2023/02/ewfeb623spd.png
120 Minute SP500 Chart:
https://captainewave.com/wp-content/uploads/2023/02/ewfeb623sp120.png
Short Term Update:
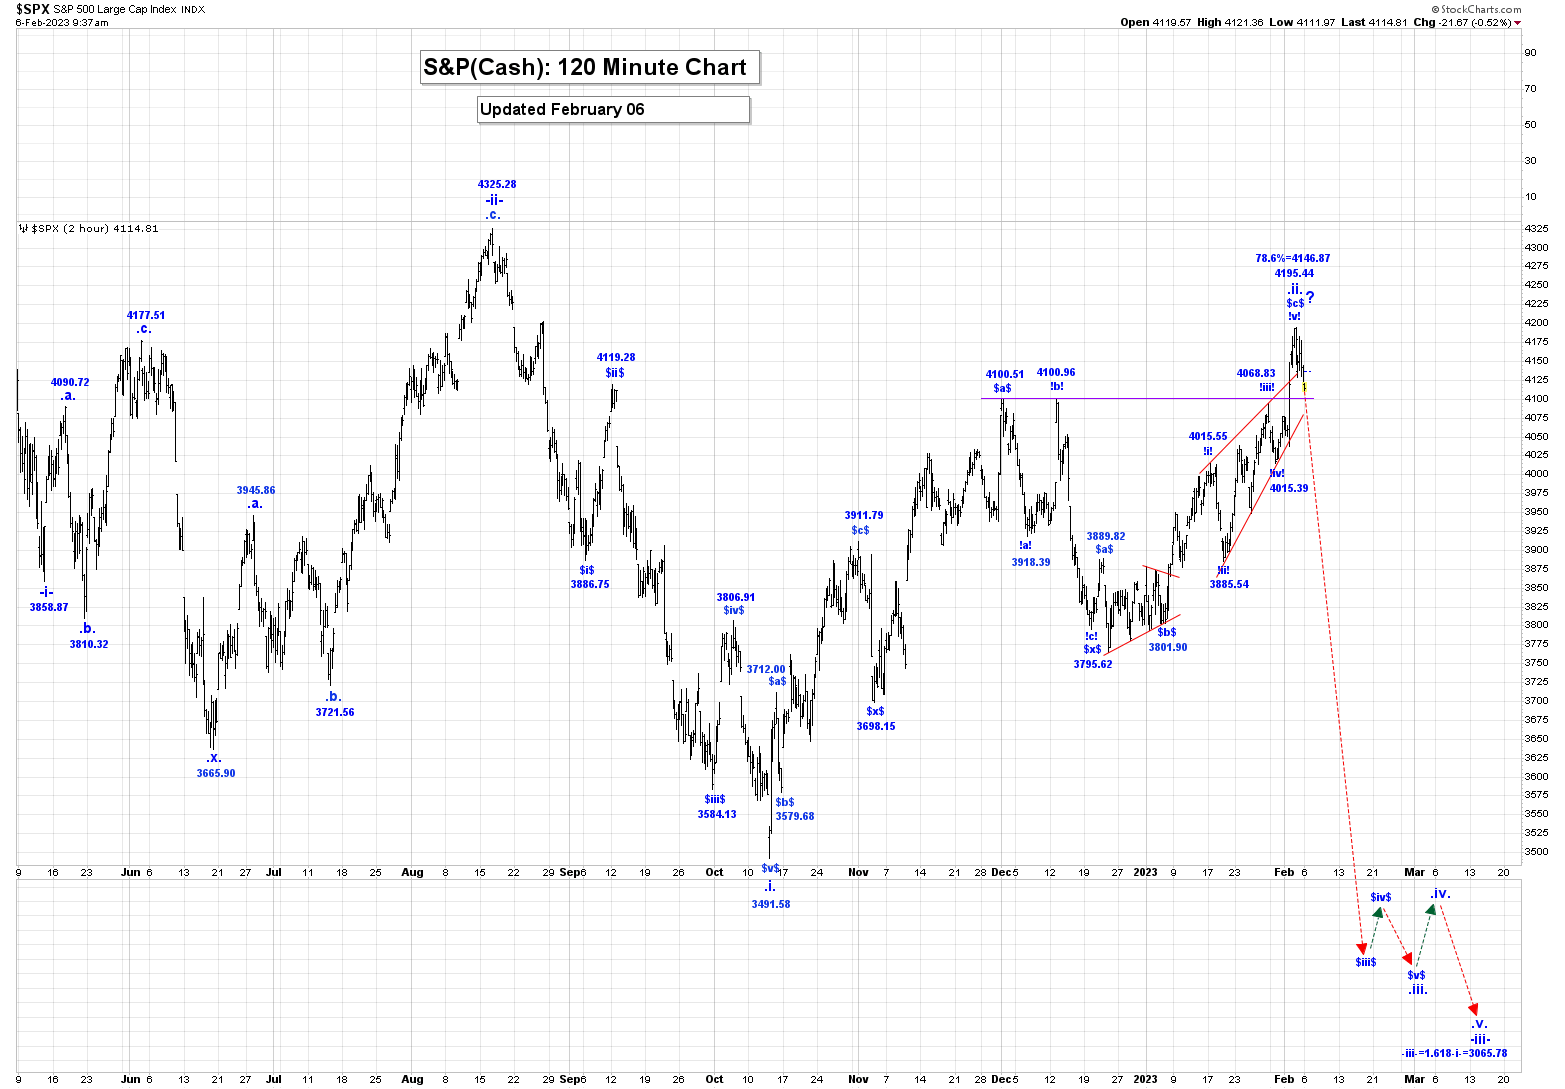
The SP500 was sharply lower in Friday’s trading session reaching a low of 4123.36. In the overnight session the SP500 Futures are down by about 27 points!
Wave v is complete at the 4748.87 high as a failure high. We have now started a multi-decade correction. We will assume that the first drop in this correction will be five (5) waves and so far, wave (i) ended at the 4222.62 and all of wave (ii) at the 4637.30 high.
We are now falling in wave (iii), that appears to be subdividing with wave -i- of (iii) ending at 3858.87 and all of wave -ii- at the 4325.28 high. We are now falling in wave -iii-, which has an initial projected endpoint of:
-iii- = 1.618-i- = 3065.78.
On the Intraday Chart it looks like within wave -iii-, wave .i. ended at 3491.58, all of wave .ii. looks to still be underway. We have updated our internal wave count for wave .ii. to suggest that it has become a double 3 wave correction, that is getting very close to completion. Our last retracement level for all of wave .ii. is:
78.6% = 4146.87.
We have now exceeded our 78.6% retracement level so we must start to turn down very soon in wave .iii. We will provide our updated projected endpoint for all of wave .iii., when we believe that all of wave .ii. is complete.
Currently, we do not have an alternate count for the SP500.
Our current projected endpoint for all of wave (iii) is:
(iii) = 2.618(i) = 3259.58.
Trading Recommendation: Go short with calls as stops.
Active Positions: Very short with calls as stops!
USDX:
Daily USDX Chart:
https://captainewave.com/wp-content/uploads/2021/07/ewjul1521usd.png
Short Term Update:
The USDX was sharply higher in Friday’s day session and that trend higher has continued in the overnight session as we have reached a high of 103.29!
All of wave ^c^ is complete at the 114.75 high and we are now falling in wave ^d^. The wave ^d^ drop must consist of at least one 3 wave pattern, so for the moment we will assume that we are falling in wave a of ^d^.
On our Daily USDX Chart we have shown a possible count for wave a where all of wave -iii- is now complete at the 100.68 low. If that is the case we are now rallying in wave -iv-, which has the following retracement levels:
23.6% = 103.78;
38.2% = 105.70.
We still expect higher prices as wave -iv- continues to unfold.
After wave -iv- ends we expect another drop in wave -v- to complete all of wave a.
Trading Recommendation: Flat.
Active Positions: Flat!
Crude Oil and Suncor:
Daily Crude Chart:
https://captainewave.com/wp-content/uploads/2023/02/ewfeb623oil.png
Short Term Update:
Crude was lower in Friday’s day session and that trend lower has continued in the overnight session as we have reached a low of 73.11.
We are now rallying in wave iii, and within wave iii, wave (i) ended at 130.50, and it looks like wave (ii) has become a triple 3 wave corrective pattern that continues to unfold, however the retracement level for this drop has become very deep, which could be suggesting that our count is not correct.
As we mentioned in our End of Week Post, our alternate count would be that all of wave i ended at the 130.50 high and we are now falling in wave ii, which has the following retracement levels:
50% = 68.50;
61.8% = 53.87.
We will stay with our current count for the moment, but our confidence level remains very low.
Our initial projection for the completion of wave iii is:
iii = 1.618i = 176.47.
Suncor: We have updated our Suncor Monthly Chart to show that all of wave A ended at 74.34 back in 2008. We completed our wave B correction at the 9.60 low in 2020, and we are now rallying higher in wave C. Within wave C we believe we are rallying in wave i and within wave I, we are rallying in wave (iii).
Within wave (iii) we are still working on wave -iv-, although it could be complete at the 26.42 low. After wave -iv- ends we expect a wave -v- rally to complete all of wave (iii). Our initial projection for then of wave (iii) is:
(iii) = 2.618(i) = 43.00.
The reason this Monthly Chart is different than our previous chart is that splits and dividends have not been removed from the stock price, which provides a much more accurate analysis.
Trading Recommendation: Go Long crude with a put as a stop. Long Suncor.
Active Positions: Long crude with put as a stop! Long Suncor!
Thanks!
Captain & Crew