The Captain has begun updating some of the gold stock chart counts… The first chart is coming later this morning (Kinross)!
Please click here for the Bob Balan Elliottwave Basics Handbook… which the Captain highly recommends:
https://captainewave.com/wp-content/uploads/2026/02/Ewave-Basics.pdf
Don’t try to learn Ewave all in one day. Focus on when the Captain is buying or selling, and the big wave counts.
From there, add more detail to your study.
If any sub needs one-on-one help with the wave counts, just some handholding during market dips, or both, shoot us an Email we’ll work out a phone talk time slot. Can buy a one-time slot or multi…
Thanks, Captain & Crew
CDNX:
CDNX Chart:
https://captainewave.com/wp-content/uploads/2026/05/ewmay426cdnx.png
Short Term Update:
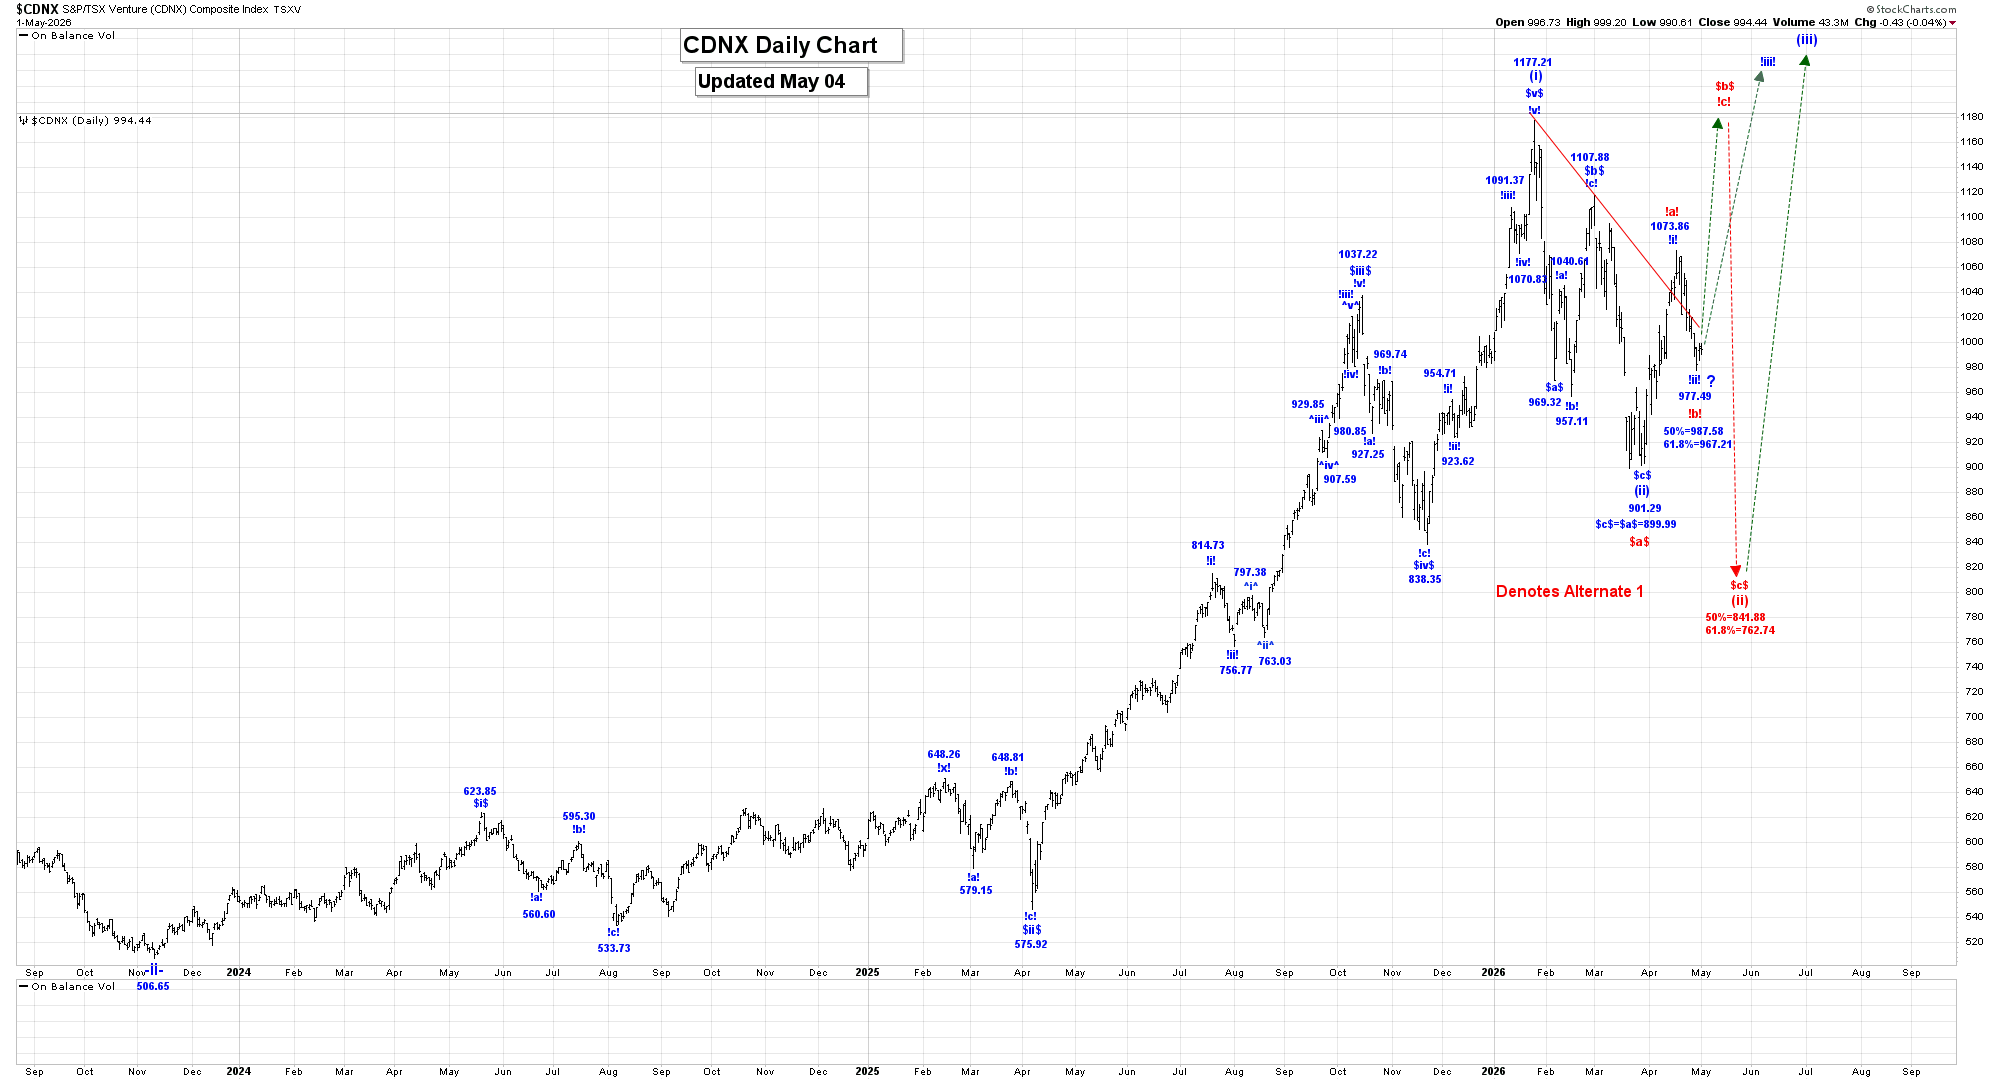
The CDNX generally moved sideways in Friday’s trading session, and we closed marginally lower at 994.44.
Our long wave -ii- correction is a triple three wave pattern, is complete at the 506.65 low. We are rallying in wave -iii-, which has an initial projected endpoint of:
-iii- = 1.618-i- = 1773.38.
Within wave -iii-, we completed wave (i) at the 1177.24 high.
We are working on the assumption that all of wave (ii) ended at the 901.29 low, and if that is the case then we have started to move sharply higher in wave (iii). The only concern we have with the above noted count is that if wave (ii) ended at the 901.29 low then is well short of our 50% retracement level, which is:
50% = 841.88.
61.8% = 762.74.
For the reason, we are looking at an alternate count as follows:
Only wave $a$ of (i) ended at the 901.29 low and we are rallying in wave $b$ that should head back or even exceed the 1177.24 high before its ends. After wave $b$ ends we expect another drop in wave $c$ into our 50 to 61.8% retracement zone to complete all of wave (ii).
For the time being, we assume that all of wave (ii) is complete at the 901.29 low, and that we are moving sharply higher in the initial stages of wave (iii).
Within wave (iii), we are working on wave $i$ and within wave $i$ we likely complete wave !i! at the 1073.86 and it that is the case then we are falling in wave !ii!, which has the following retracement levels:
50% = 987.58.
61.8% = 967.21.
We have entered our retracement zone, so we need to be on guard for the completion of wave !ii! and the start of another rally in wave !iii!. For the alternate case, replace wave !i! with wave !a!, wave !ii! with wave !b! and wave !iii! with wave !c!.
Trading Recommendation: Flat.
Active Positions: Flat!
GDX & Gold Stocks:
GDX 60 Min Chart:
https://captainewave.com/wp-content/uploads/2026/05/ewmay426gdx60.png
GDX Daily Chart:
https://captainewave.com/wp-content/uploads/2026/05/ewmay426gdxd.png
Short Term Update:
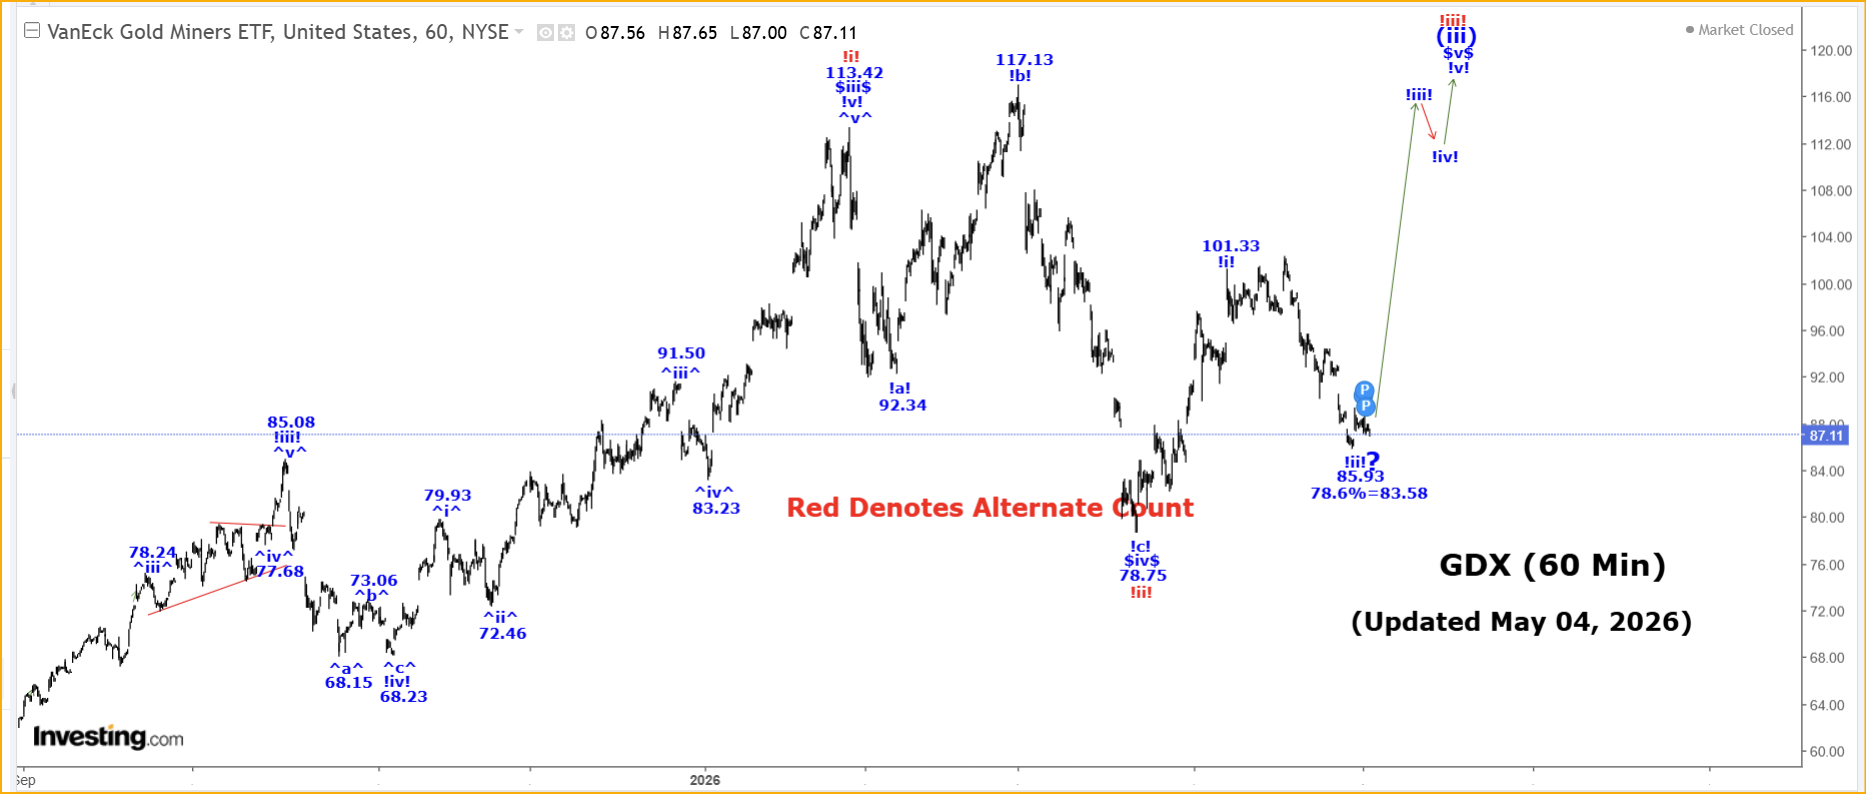
The GDX was lower in Friday’s trading session, reaching a low of 87.00, closing at 87.11.
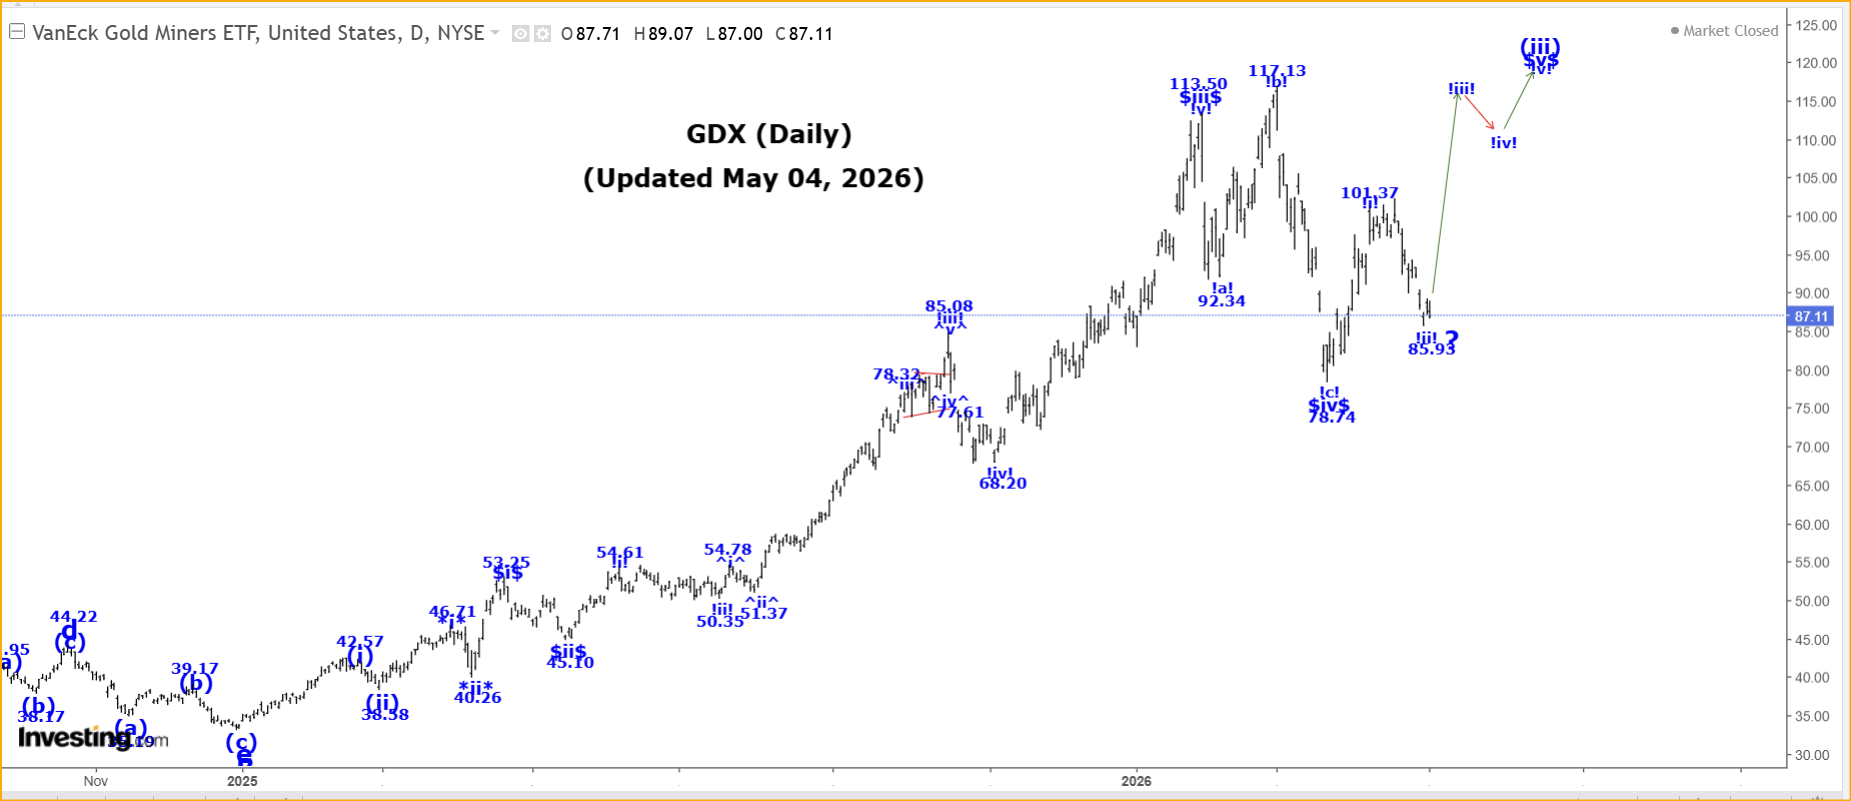
We are continuing to rally in a multi-year wave C thrust higher.
Within wave C, we completed wave (i) at the 42.47 high and all of wave (ii) at the 38.58 low. We should be moving sharply higher in wave (iii), and we do not have an updated projected endpoint to provide at this moment.
Within wave (iii), it looks like we are subdividing with wave *i* ending at 46.71 and wave *ii* at 40.32, if that is the case then we are still moving higher in wave *iii*, which we do not have another endpoint to share at the moment.
Within wave *iii*, we completed wave $i$ at 53.25, wave $ii$ at 45.10, wave $iii$ at 113.50 and wave $iv$ at 78.74. We are moving higher in wave !i! of $v$.
Within wave $v$, we likely completed wave !i! at the 101.33 high and if that is the case then we are falling in wave !ii!, which has a last retracement level of:
78.6% = 83.78.
For our current short term analysis to remain valid we do not want to trade much below our 78.6 % retracement level. We need to be on guard for the completion of wave !ii! and the start of another rally in wave in wave !iii!. We will provide our initial projected endpoints for wave !iii!, when we believe that all of wave !ii! is complete.
We are looking at the possibility that wave $iii$ is extending, if it is then the count would be:
!i! = 113.42
!ii! = 78.75.
!iii! rally is underway.
New updates on our Gold Stock and Indices are coming and we have completed IMG and K Weekly Charts.
Kinross (Updated May 4th, 2026):
Wave A ended at 31.88 in 1996 a bullish wave B triangle formation at 3.00. We are moving higher in wave C, and it looks like wave i of C is complete at the 39.11 high. We are falling in wave ii, which has the following retracement levels:
50% = 21.05.
61.8% = 16.78.
Within wave ii, we likely completed wave (a) of ii at 26.06 and are moving higher in wave (b). After wave (b) ends we expect another drop in wave (c), to complete all of wave ii.
After wave ii ends we expect a very sharp rally in wave iii of C.
Our current long term projected endpoint for wave C is:
C = 1.618A = 54.58.
ABX (Updated December 30th, 2024):
Wave A was a 3-wave rally that ended at 54.43 in 2008 and we are currently working on a wave B bullish triangle, which is still underway. Our current wave B bullish triangle looks like:
a = 5.81;
b = 30.69;
c = 13.01;
d = 21.35;
e = 15.11, if complete to complete all of wave B. Wave e cannot drop below the wave c low of 13.01, for our current triangle formation to remain valid.
After our wave B bullish triangle ends, we expect a massive thrust higher in wave C. We will provide our updated projections for the end of wave C, when we believe that all wave B is complete.
HUI (Updated December 30th 2024):
Wave A ended at 519.61 in 2008, and it looks like all our wave B bullish triangle is expanding and extending, with the following endpoints:
(a) = 99.19;
(b) = 373.85;
(c) = 172.86:
(d) = 354.40;
(e) = 275.23, if complete to complete all of the wave B bullish triangle. Wave (e) cannot drop below the wave (c) low of 172.86 for our current triangle formation to remain valid.
After our wave B bullish triangle ends, we expect a massive thrust higher in wave C. We will provide our updated projections for the end of wave C, when we believe that all wave B is complete.
XAU (Updated August 07th, 2024):
Wave B ended at the 38.37 low in 2016 and we are rallying in a long-term wave C. Within wave C , we completed wave i at 101.76 and all of a complex wave ii at 60.59. We are rallying in wave iii, which that following projected endpoint:
iii = 4.236i = 329.11.
Within wave iii, we believe that wave (i) ended at 167.09 and wave (ii) at 90.08. We are rallying in wave (iii), which has an initial projected endpoint of:
(iii) = 1.618(i) = 262.40.
Within wave (iii), it looks like wave -i- ended at 135.15 and wave -ii- at 102.60, and we are rallying in wave -iii-, which has an initial projected endpoint of:
-iii- = 1.618-i- = 181.70.
We expect higher prices in the months ahead as we continue to rally higher in wave -iii- of (iii).
SSR Mining (Updated November 25th, 2023):
Wave A ended at 48.16 in 2007, and since that high was made, we have been working on a bullish wave B triangle formation that has the following make-up, so far:
a = 3.66;
b = 25.32;
c = 11.05, if complete;
d rally after wave c ends and we cannot rally above the 25.32 high;
e drop after wave d ends and we cannot drop below the wave c low.
Wave d needs to consist of at least one 3 wave pattern.
Newmont Mining: (Updated August 04th, 2024):
Newmont Mining is following a rather complex Ewave pattern, as we are currently working on a double 3 wave pattern, likely all within a larger multi-decade wave (A). Within the wave (A), we completed our first 3 ABC pattern in 1996 at 79.83, which was followed by a wave X drop to 12.44. After wave X ended, we are rallying in our second ABC pattern, with wave A ending at 61.19 and wave B at 15.02. We are rallying in wave C and within wave C we completed wave i at 86.37 and wave ii at 29.42. We are starting to rally in a multiple year wave iii, which has the following initial projected endpoint:
iii = 1.618i = 144.86.
Within wave iii, we are still working on wave (i).
Longer term our current projected endpoint for our second wave C is:
C = 2.618A = 142.65.
IMG: (Updated May 4th, 2026):
IMG completed wave A at the 23.79 high in November of 2011 and a complex wave B, which ended at the 1.26 low in October, 2022. We continue to moved higher in wave i of C, which looks to be complete at the 34.09 high. If that is the case then we are falling in wave ii, which has the following retracement levels:
50% = 17.68.
61.8% = 13.80.
Within wave ii, it is still unclear what the internal wave structure is going to look like.
After wave ii ends, we expect a very sharp rally higher in wave iii of C. Our current projection for the end of wave C is:
C = 1.618A = 39.75.
Trading Recommendation: Long TSE:XGD
Active Positions: Long TSE:XGD!
Gold:
Daily Gold Cash Chart:
https://captainewave.com/wp-content/uploads/2026/05/ewmay426gold.png
Short Term Update:
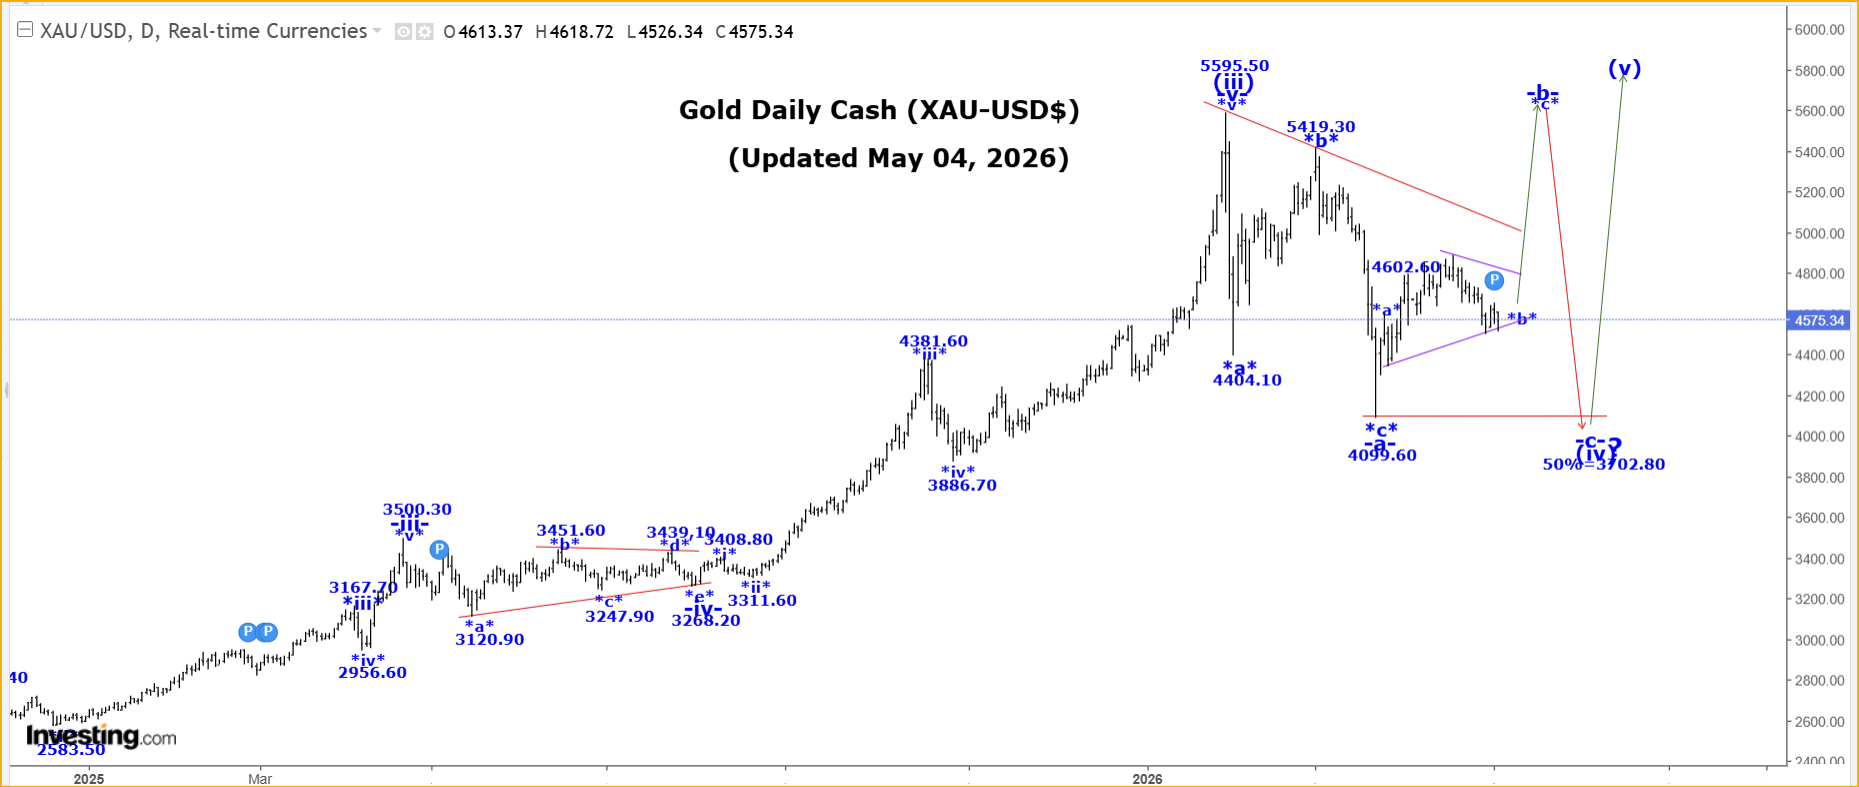
Gold was higher in Friday’s day session reaching a high of 4660.20. In the overnight session we have moved lower reaching a low of reached a low of 4526.30.
We are using the symbol XAU/USD for our current gold pricing analysis.
Gold is generally moving in a multi-decade incomplete impulsive fashion, form the 35.20 low made back in 1970. Within this impulsive moved, we have the following count:
1 = 1920.80.
2 = 1046.20.
3:
i = 2073.40.
ii = 1614.40
iii:
(i) = 2073.30.
(ii) = 1810.10.
(iii) = 5595.40.
(iv):
-a-:
*a* = 4404.10.
*b* = 5419.30.
*c* = 4099.60, to complete all of wave -a-.
-b-:
*a* = 4602.20.
*b* triangle:
!a! = 4351.20.
!b! = 4889.20.
!c! = 4510.20, if complete.
!d! rally is underway and cannot trade above the 4889.20 high.
!e! drop after wave !d! ends to complete all of the wave *b* bullish triangle.
*c* rally after wave *b* ends.
(v) rally after wave (iv) ends.
Wave (iv) is going to become more complex than just a simple 3-wave corrective pattern, as it looks like we only completed wave -a- at the 4099.60 low. If that is the case, we should be moving higher in wave -b-, which could rally to or even exceed the all time high of 5595.50 before it ends. After wave -b- ends we expect another drop back to at least the wave -a- low of 4099.60.
The other option to watch is that wave (iv) is becoming a large bullish triangle, and it this case, we will not be re-visiting the wave a- low of 4099.60 again, before this correction ends.
The initial target for the end of wave -b- in the bullish triangle formation option would be the red downtrend line shown in our Daily Gold Chart which is around $5100/$5200. Wave -b- could also exceed the all-time high before it ends also.
After wave (iv) ends we expect another rally to all time new highs in wave (v).
Trading Recommendation: Flat!
Active Positions: Flat!
Silver:
Daily Silver Cash Chart:
https://captainewave.com/wp-content/uploads/2026/05/ewmay426si.png
Short Term Update:
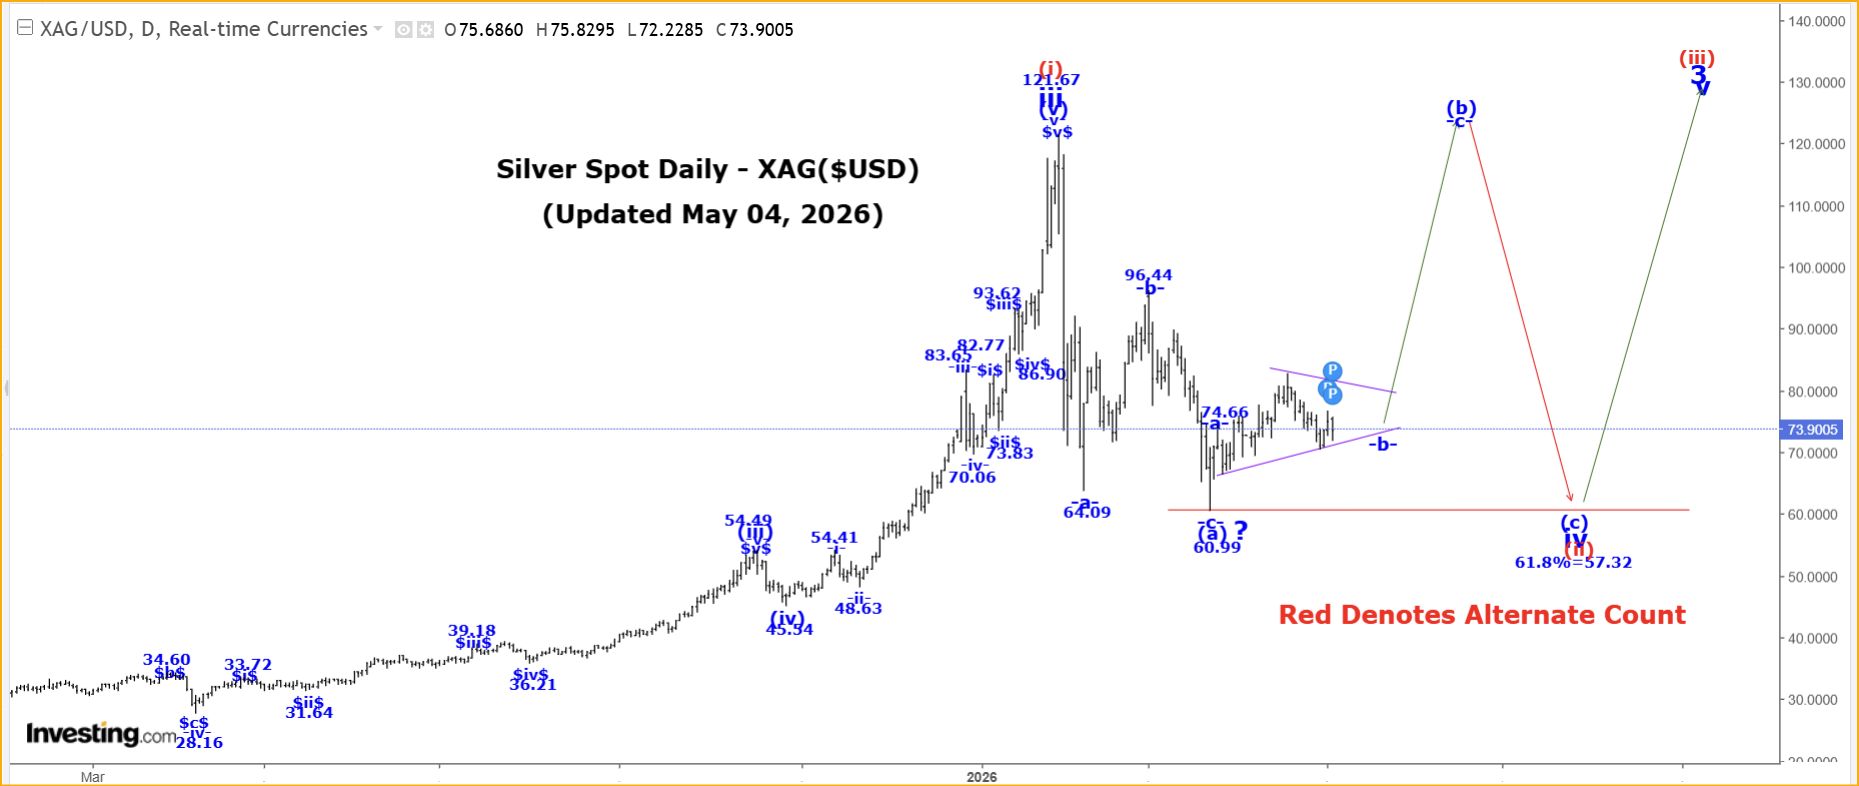
Silver was higher again in Friday’s day session reaching a high of 76.97. In the overnight session we have moved lower reaching a low of 72.23.
We are using the symbol XAG/USD for our current silver pricing analysis.
Wave iii ended at the 121.67 and it looks like wave iv is going to become more complex than just a simple 3-wave corrective pattern, as it looks like we only completed wave (a) at the 60.97 low. If that is the case, then we should be starting to move higher in wave (b), which could rally to or even exceed the all time high of 121.67 before it ends.
After wave (b) ends we expect another drop back to at least the wave (a) low of 60.97. The other option to watch is that wave iv is becoming a large bullish triangle, and it this case, we will not be re-visiting the wave (a) low of 60.97 again, before this correction ends.
Within wave (b), we appear to be working on the following internal count:
-a- = 74.66.
-b- triangle:
!a! = 67.72.
!b! = 83.06.
!c! = 70.87, if complete.
!d! rally is underway and cannot trade above the 83.06 high.
!e! drop after wave !d! ends to complete all of our wave -b- bullish triangle.
-c- rally after wave -b- ends.
The wave iv correction was rather deep, which could be suggesting that wave iii is still underway with an alternate count as follows:
(i) = 121.67.
(ii) = 60.99.
(iii) rally is underway
If our alternate count is correct then wave iii is heading to the $275/300 level.
Trading Recommendation: Long PSLV:TSX!
Active Positions: Long PSLV:TSX!
US 10 Year Bond Yield:
Daily US 10 Year Bond Yield Chart:
https://captainewave.com/wp-content/uploads/2026/05/ewmay426bond.png
Short Term Update:
The US 10 Year Bond Yield was lower again in Friday’s day session reaching a low of 4.341%.
In the overnight session we have moved higher reaching a high of 4.418%!
Wave i is still underway, as shown on our Daily Chart.
Within wave i, we completed wave (i) at 1.266%, wave (ii) at 0.504, wave (iii) at 4.997% and it is looking like we are still falling in a more complex wave -e- of (iv), which we are assuming is complete at the 3.947% low.
We should be starting to rally higher in wave (v) and within wave (v) we completed wave -i- at 4.161% and wave -ii- at 3.956%, so we should be moving higher in wave -iii-, which has an updated projected endpoint:
-iii- = 4.236-i- = 4.860%
It looks like wave -iii- is subdividing with wave *i* ending at 4.487% and we are falling in wave *ii*, which has the following retracement levels:
50% = 4.220%.
61.8% = 4.160%.
After wave *ii* ends we expect another ally in wave *iii*.
We expect higher prices as wave -iii-continues to develop. After wave -iii- ends, we expect a wave -iv- drop that retraces between 23.6 to 38.2% of the entire wave -iii- rally.
Our projections for the end of wave (v) are:
(v) = 4.997%.
(v) = 1.618(i) = 5.370%!
Trading Recommendation: Long risking to 3.880%.
Active Positions: Long risking to 3.880%!
S&P500:
Daily SP500 Chart:
https://captainewave.com/wp-content/uploads/2026/05/ewmay426spd.png
120 Minute SP500 Chart:
https://captainewave.com/wp-content/uploads/2026/05/ewmay426sp120.png
Short Term Update:
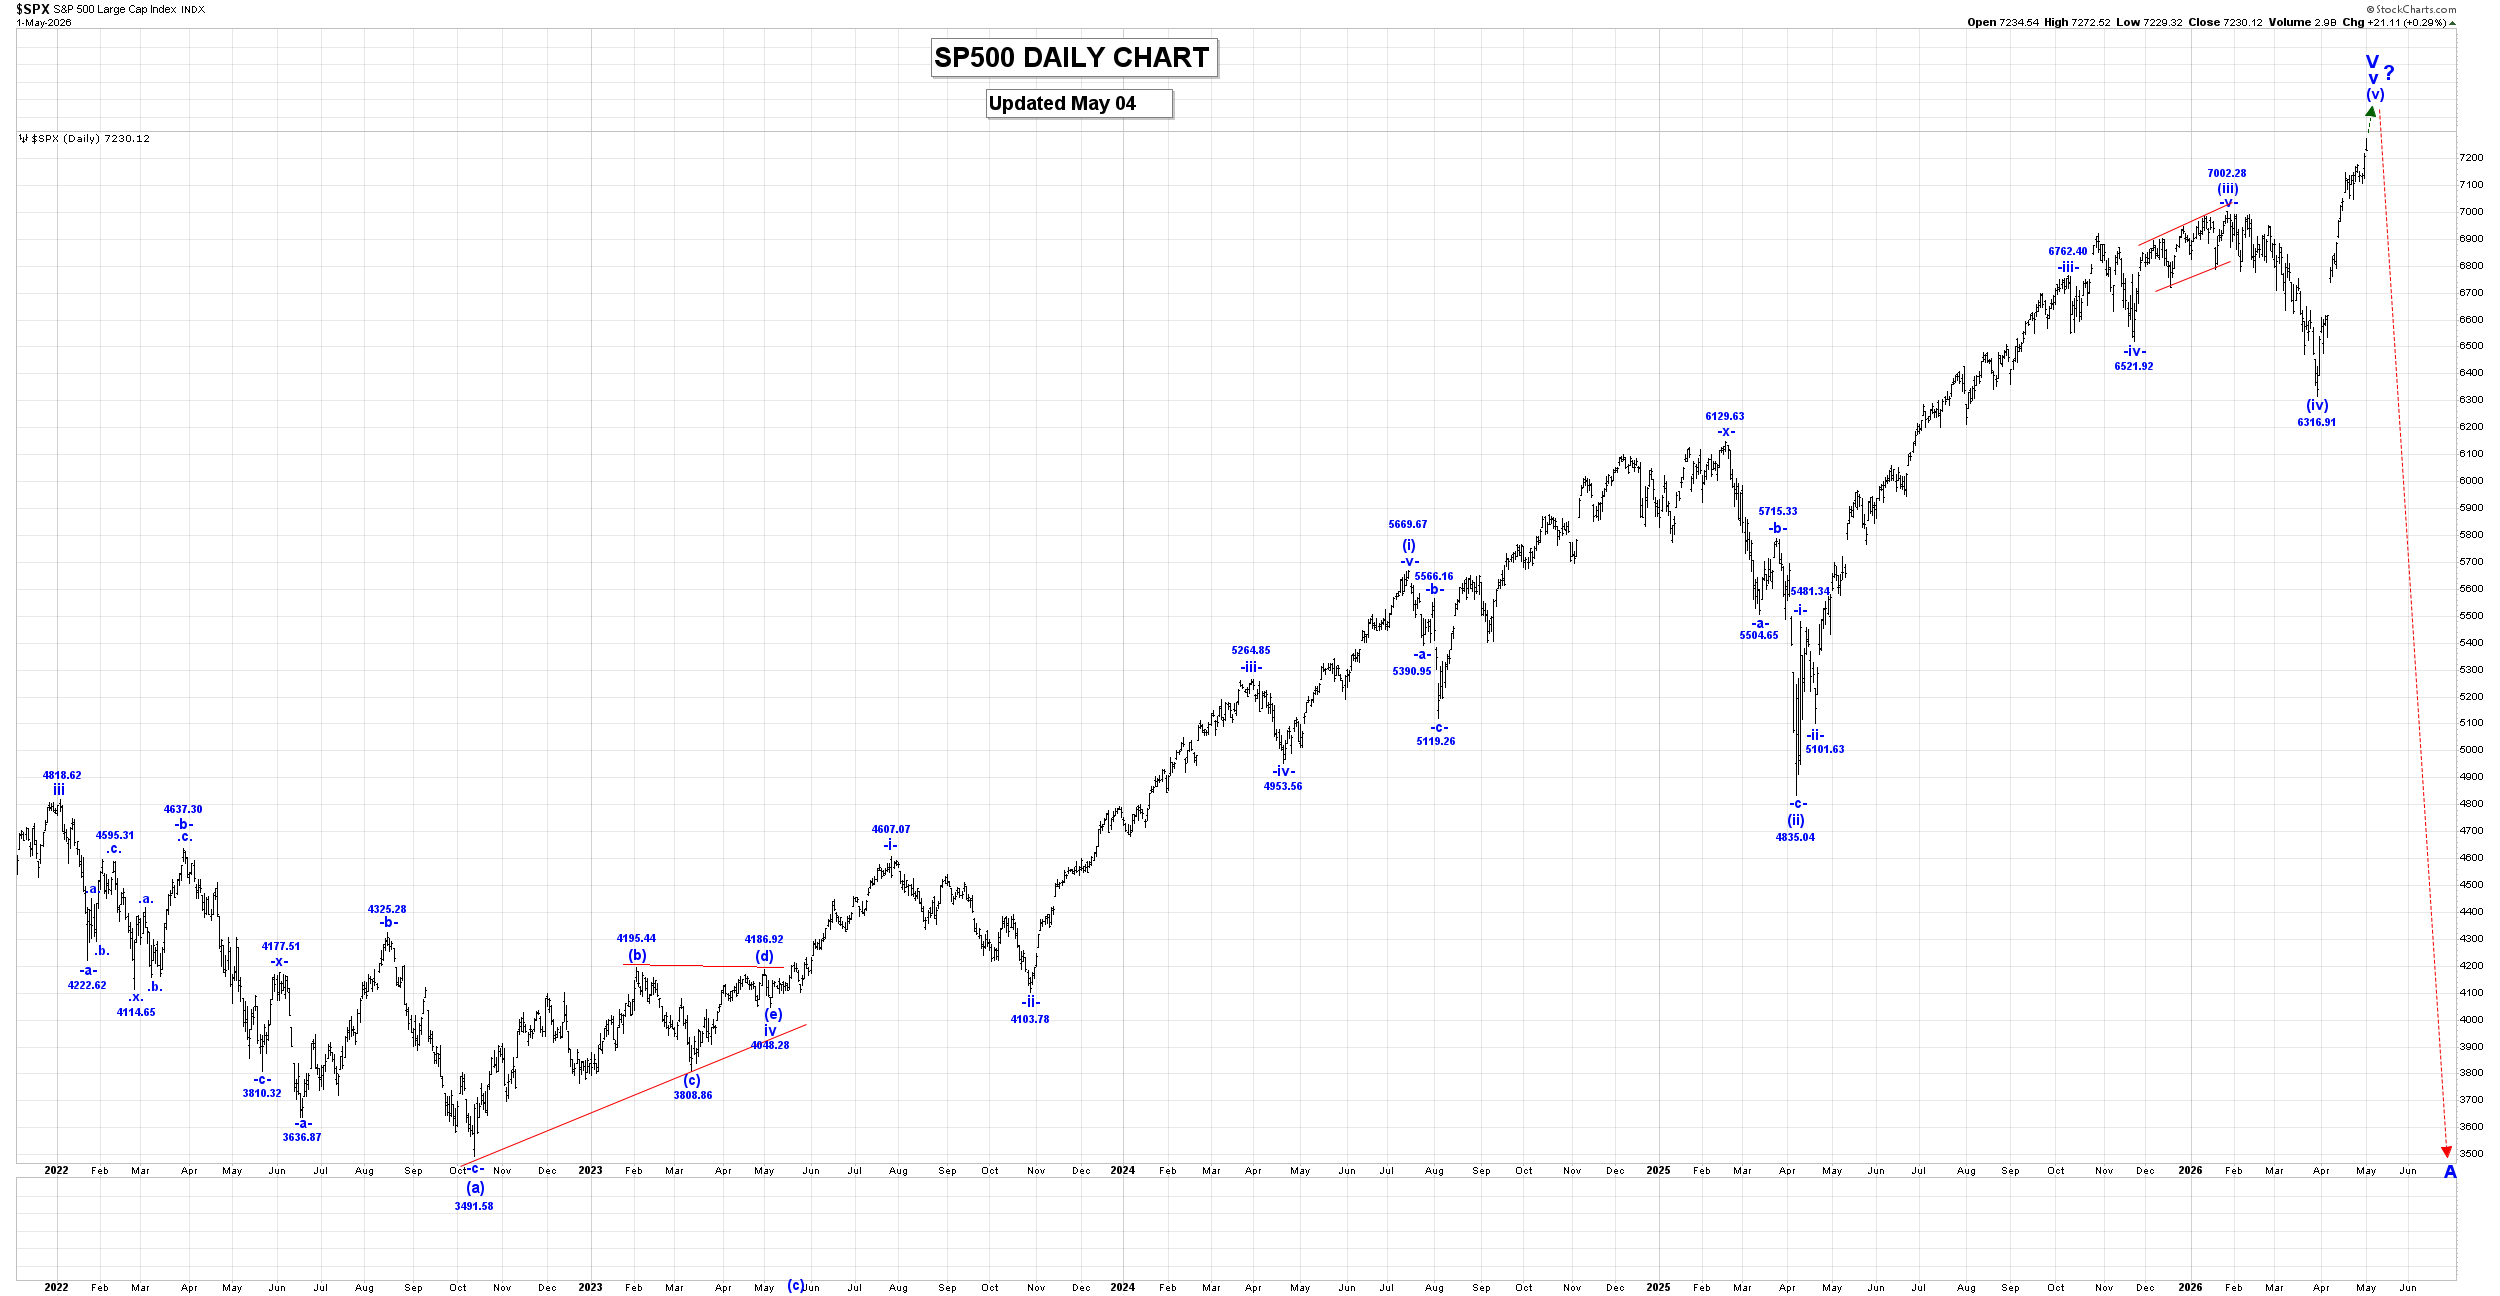
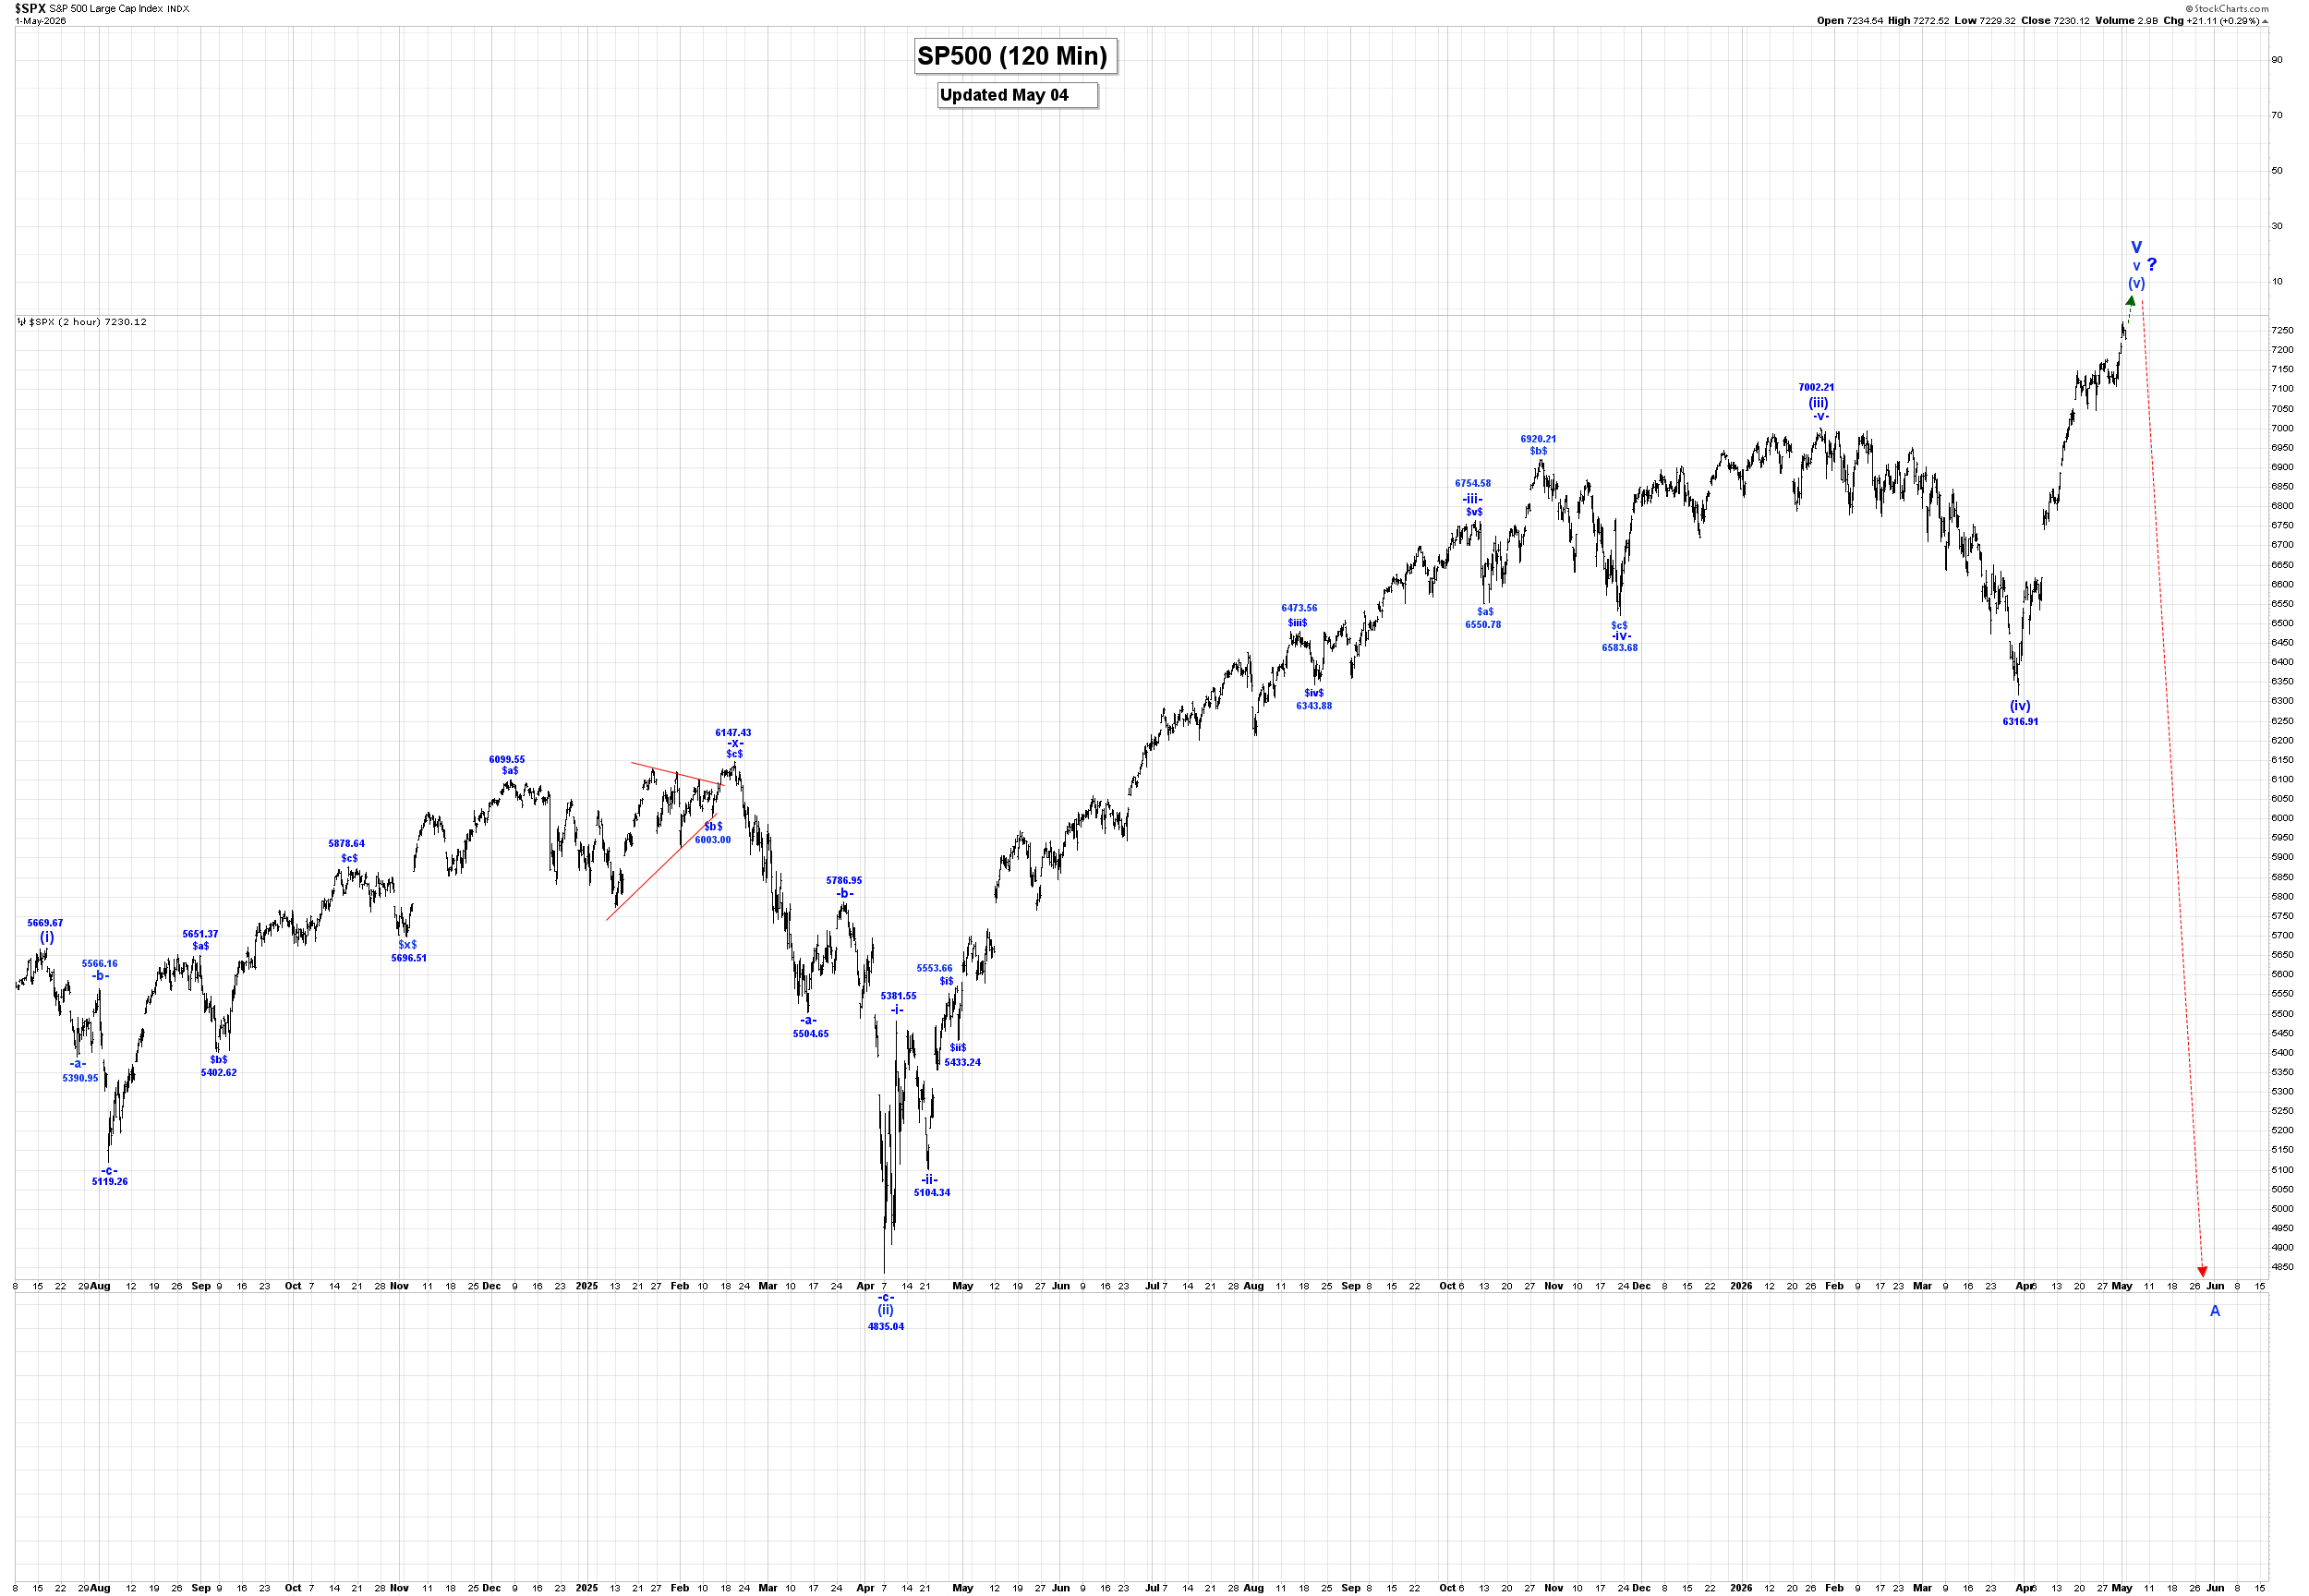
The SP500 was higher again in Friday’s trading session reaching another all-time high at 7272.52.
In the overnight session we have moved lower reaching a low of 7186.40!.
We have updated our count within all of wave v to suggest the following:
(i) = 5669.67.
(ii) = 4835.04.
(iii) = 7002.28.
(iv) = 6316.91.
(v):
-i- is still underway.
We continue to move higher in wave -i- of (v), and after wave -i- ends we expect a wave -ii- correction that retraces between 50 to 61.8% of the entire wave -i- rally.
Trading Recommendation: Flat
Active Positions: Flat!
USDX:
Daily USDX Chart:
https://captainewave.com/wp-content/uploads/2026/05/ewmay426usd.png
Short Term Update:
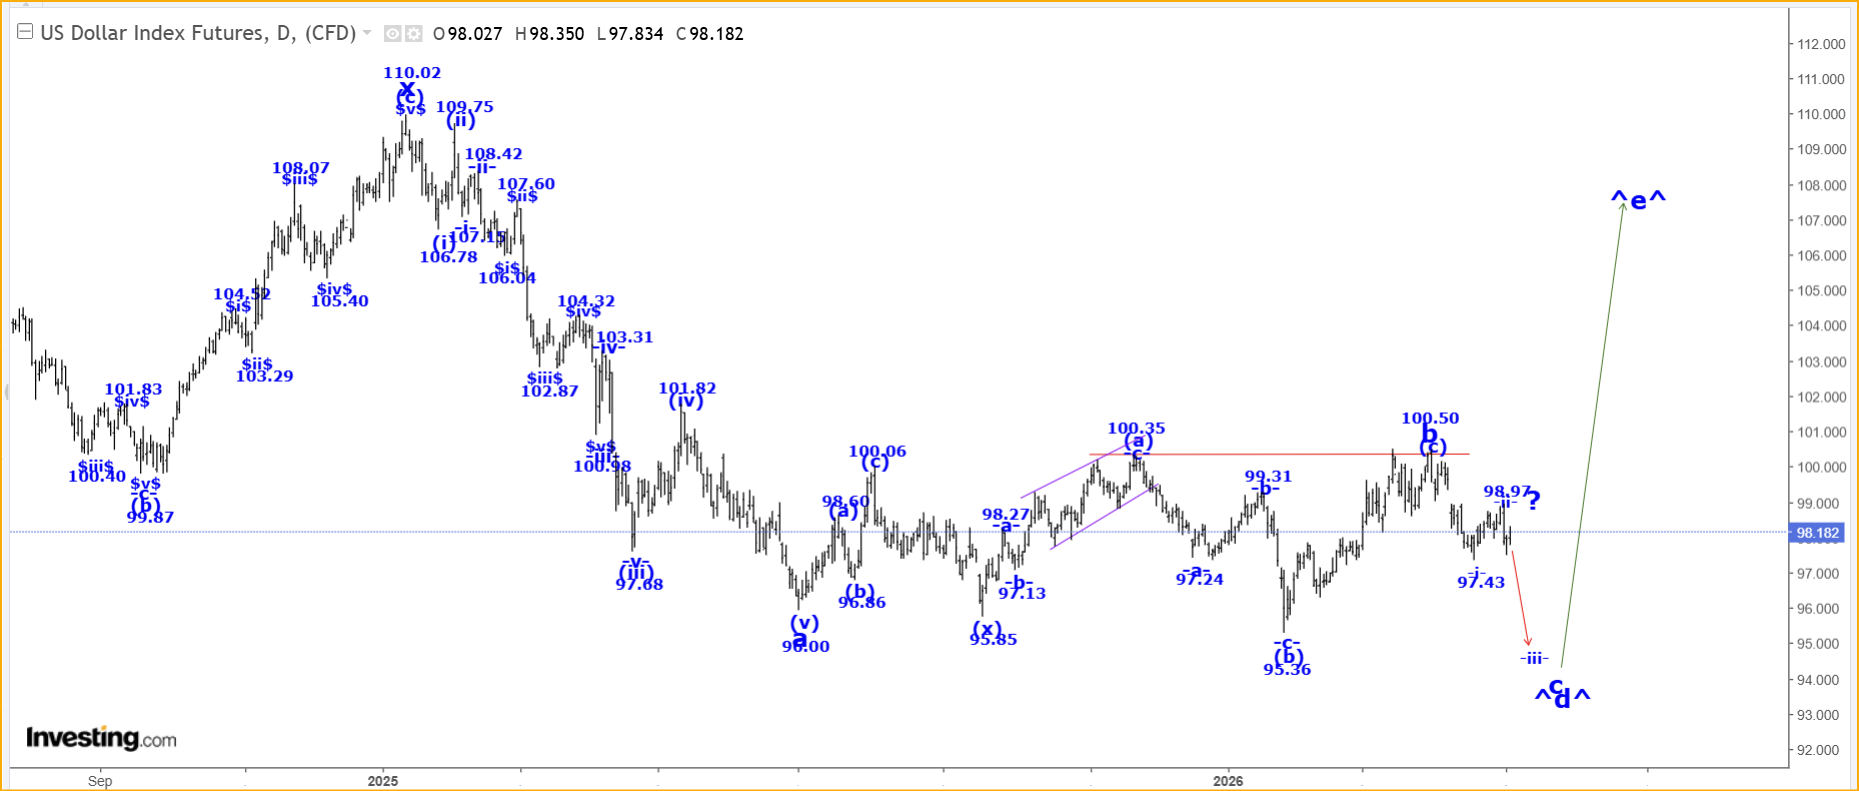
The USDX was lower in Friday’s day session reaching a low of 97.57. In the overnight session we have moved higher reaching a high of 98.35!
All of wave ^c^ is complete at the 114.75 high and we are falling in wave ^d^. Within wave ^d^, we have updated our internal wave count to suggest that it has become a double three wave pattern as follows:
a = 100.68.
b triangle = 103.28.
c = 99.22.
x = 110.02.
a = 96.00
b = 100.50.
c:
(i):
-i- = 97.43.
-ii- = 98.97.
-iii- drop is now underway, with projection levels coming in the next day or so.
Our second wave b is complete at 100.50, and we should be moving lower in our second wave c, which has the following projected endpoints:
c = 0.618a = 91.84.
c = a = 86.48.
c = 1.618a = 77.82.
Within our second wave c, we are likely falling in wave -iii- of (i) of c.
Trading Recommendation: Short risking to 105.00!
Active Positions: Short risking to 105.00!
Crude Oil:
Daily Crude Chart:
https://captainewave.com/wp-content/uploads/2026/05/ewmay426oil.png
Short Term Update
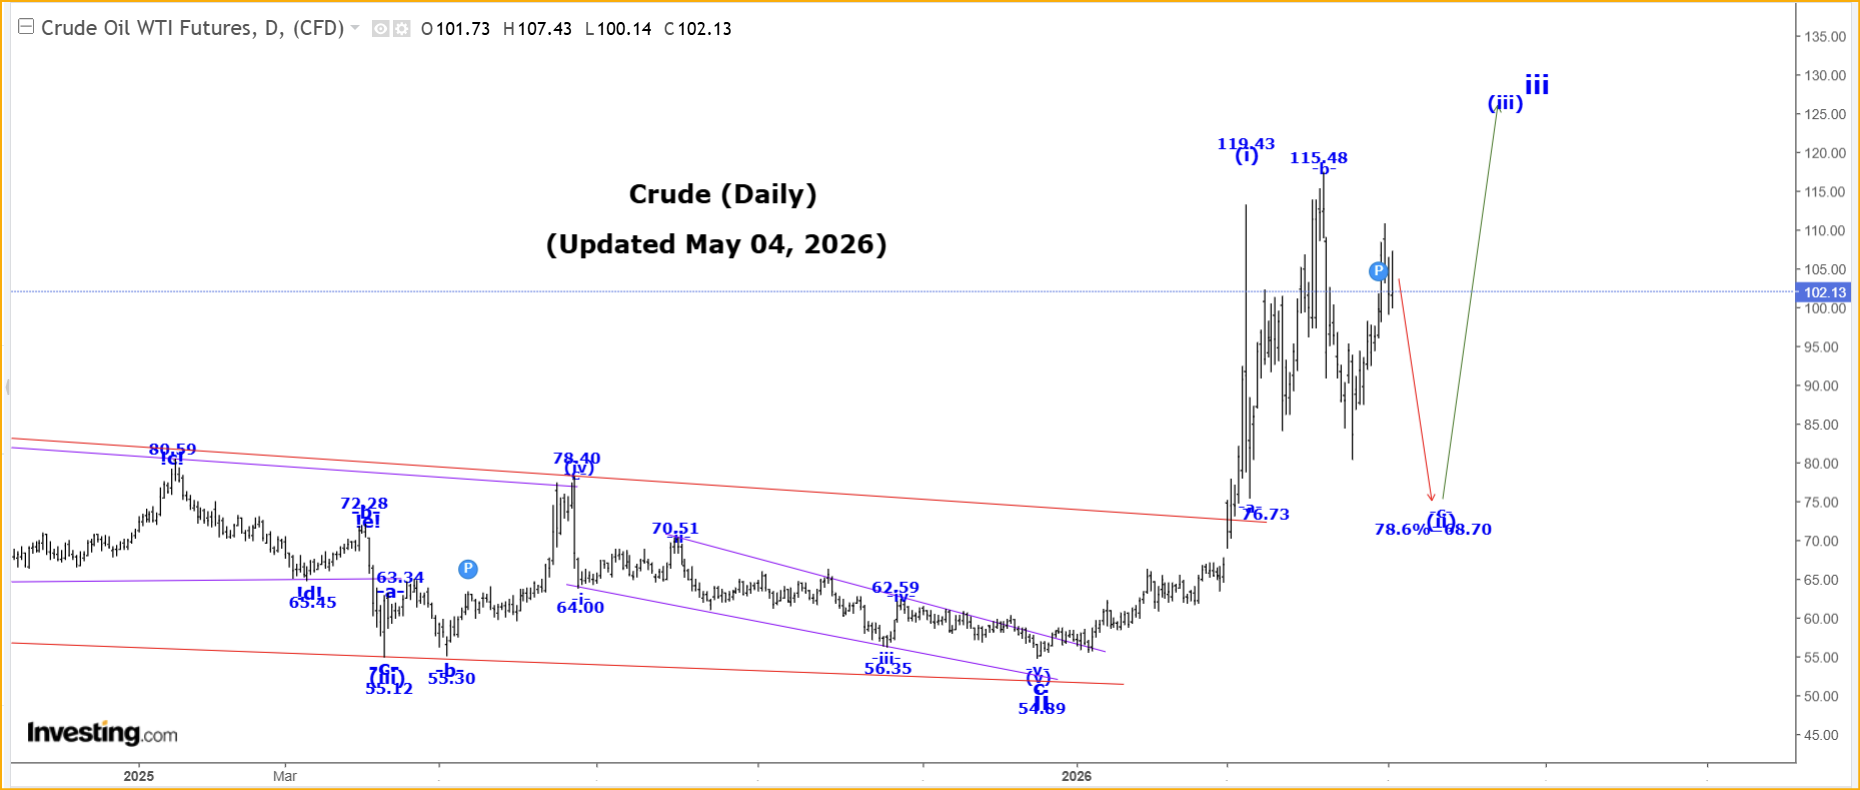
Crude was lower in Friday’s day session and that trend lower continued early in the overnight session as we reached a low of 99.11. After that low was made, we moved higher reaching a high of 107.43!
Wave i ended at the 126.42 high and wave ii correction at the 54.89 low.
We are moving higher in wave iii, and within wave iii, we completed wave (i) at the 119.43 high, and we are falling in wave (ii), which has a last retracement level of:
78.6% = 68.70.
We have already entered our retracement zone, but we suspect that we completed only wave -a- of (ii), at the 76.73 low. If that is the case then we are moving higher in wave -b-, although we are strating to think that wave -b- is still underway as a bearish triangle, which would have the following internal wave structure:
!a! = 117.63.
!b! = 80.56.
!c! = 110.90, if complete and cannot rally above the wave !a! high.
!d! drop is likely started, and cannot drop below 80.56.
!e! rally after wave !d! ends to complete all of our bearish wave -b- triangle..
After our wave -b- bearish triangle ends we expect a drop back to at least the wave -a- low of 76.73, to complete all of wave (ii).
Trading Recommendation: Long crude with a put as a stop. Long Suncor.
Active Positions: Long crude with puts as a stop! Long Suncor!
Thanks!
Captain & Crew