Captain Ewave Weekly Charts Post!
Weekly Gold Chart: https://captainewave.com/wp-content/uploads/2025/10/ewoc1825gold.png
Long Term Update:
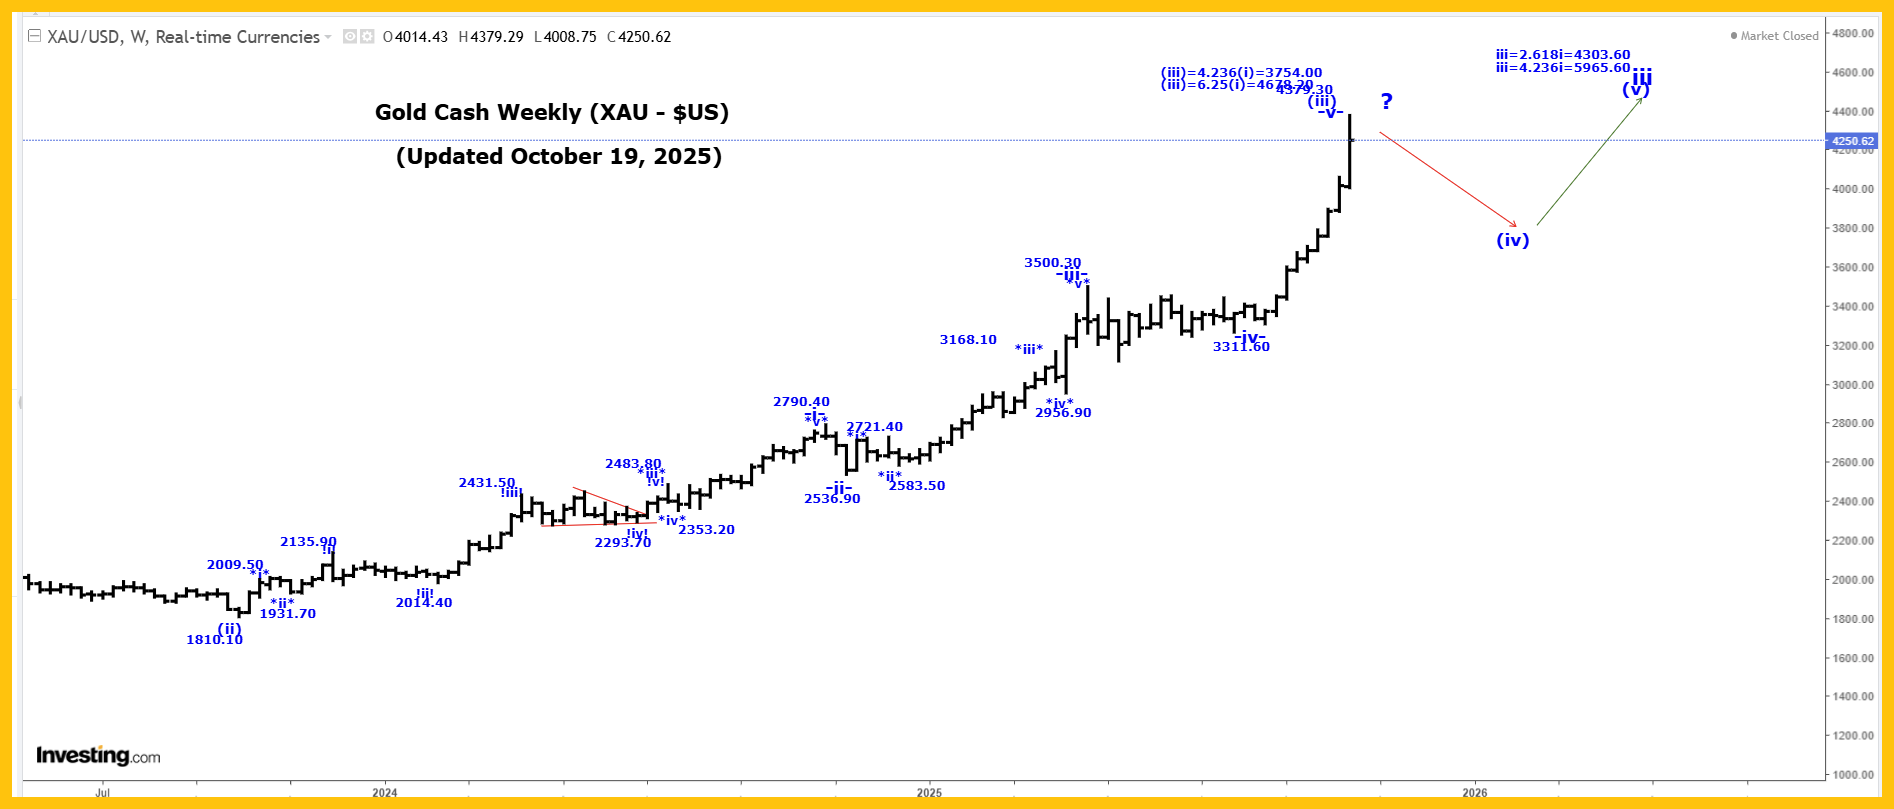
Gold was sharply higher again this past week reaching another all-time high at 4379.30, closing at 4250.60!
Our current long-term gold count starting from the 35.20 low made back in 1971, which remains incomplete, is follows:
1 = 1920.80.
2 = 1046.20.
3:
i = 2073.40.
ii = 1614.40.
iii:
(i) = 2073.30.
(ii) = 1810.10.
(iii):
-i- = 2790.40.
-ii- = 2539.90.
-iii- = 3500.30.
-iv- = 3280.60.
-v- is still underway, to complete wave (iii).
Projections for the end of wave (iii) are:
(iii) = 4.236(i) = 3753.00.
(iii) = 6.25(i) = 4678.20.
It appears that waves -v- and (iii) are still underway, although we did have key daily reversal lower in Friday’s day session, which may be a sign that those waves are now complete the 4379.30 high.
After wave (iii) ends we expect a wave (iv) correction that retraces between 23.6 to 38.2% of the entire wave (iii) rally.
A projection for the end of wave iii is:
iii = 4.236i = 5965.60.
Projections for the end of wave 3 are:
3 = 2.618(1) = 5936.00.
3 = 4.236(1) = 9033.60
We still cannot rule the possibly that wave -v- is going to move substantially higher and in that case, likely only wave *i* of -v- of (iii) may have ended at the 4379.30 high and if that is the case then we would now be falling in a wave *ii* correction that should retrace between 50 to 61.8% of the entire wave *i* rally.
Active Positions: Long with puts as stops!
Silver:
Weekly Silver Chart: https://captainewave.com/wp-content/uploads/2025/10/ewoc1925si.png
Long Term Update:
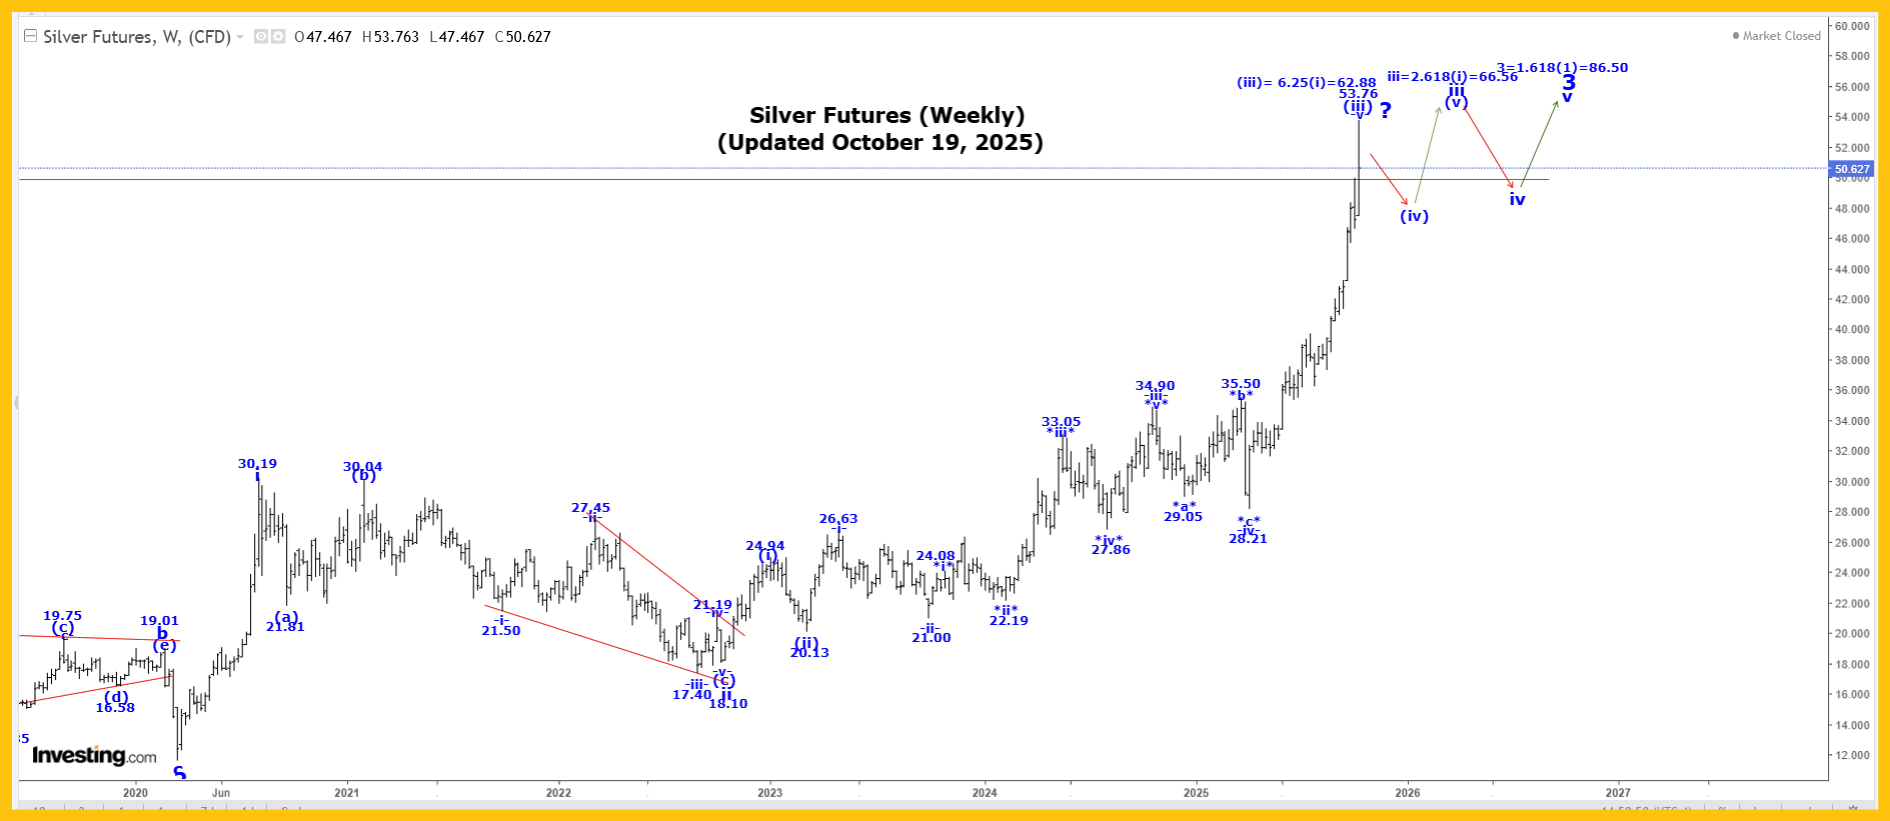
Silver was also sharply higher again this past week reaching another all-time high at 53.76, closing at 50.63!
We are moving higher in wave 3, as shown on our Weekly Silver Chart. Within wave 3, we completed wave i at 29.91 and wave ii at 18.01 and we are now continuing to move higher in a subdividing wave iii.
Our current and next projected endpoints for wave iii is:
iii = 2.618(i) = 66.56.
Within wave iii, we completed wave (i) at 24.39, wave (ii) at 19.94 and we appear to still be moving higher in (iii), which has an updated projected endpoint of:
(iii) = 6.25(i) = 62.88.
We did have a key daily reversal in Friday’s day session, so we need to be guard for the possibly that all of wave (iii) ended at the 53.76 high. After wave (iii) ends we expect a wave (iv) correction that should retrace between 23.6 to 38.2% of the entire wave (iii) rally.
In the very long term, we completed all of wave III at 49.00 in 1980 and all of wave IV at 3.55 in 1993. We are now working on wave V and within wave V we have the following count;
1 = 49.82;
2 = 11.64;
3 = First projection is 86.50.
Active Positions: Long with puts as our stop!
US 10 Year Bond Yield:
Monthly US 10 Year Bond Chart: https://captainewave.com/wp-content/uploads/2025/10/ewoc1925bond.png
Long Term Update:
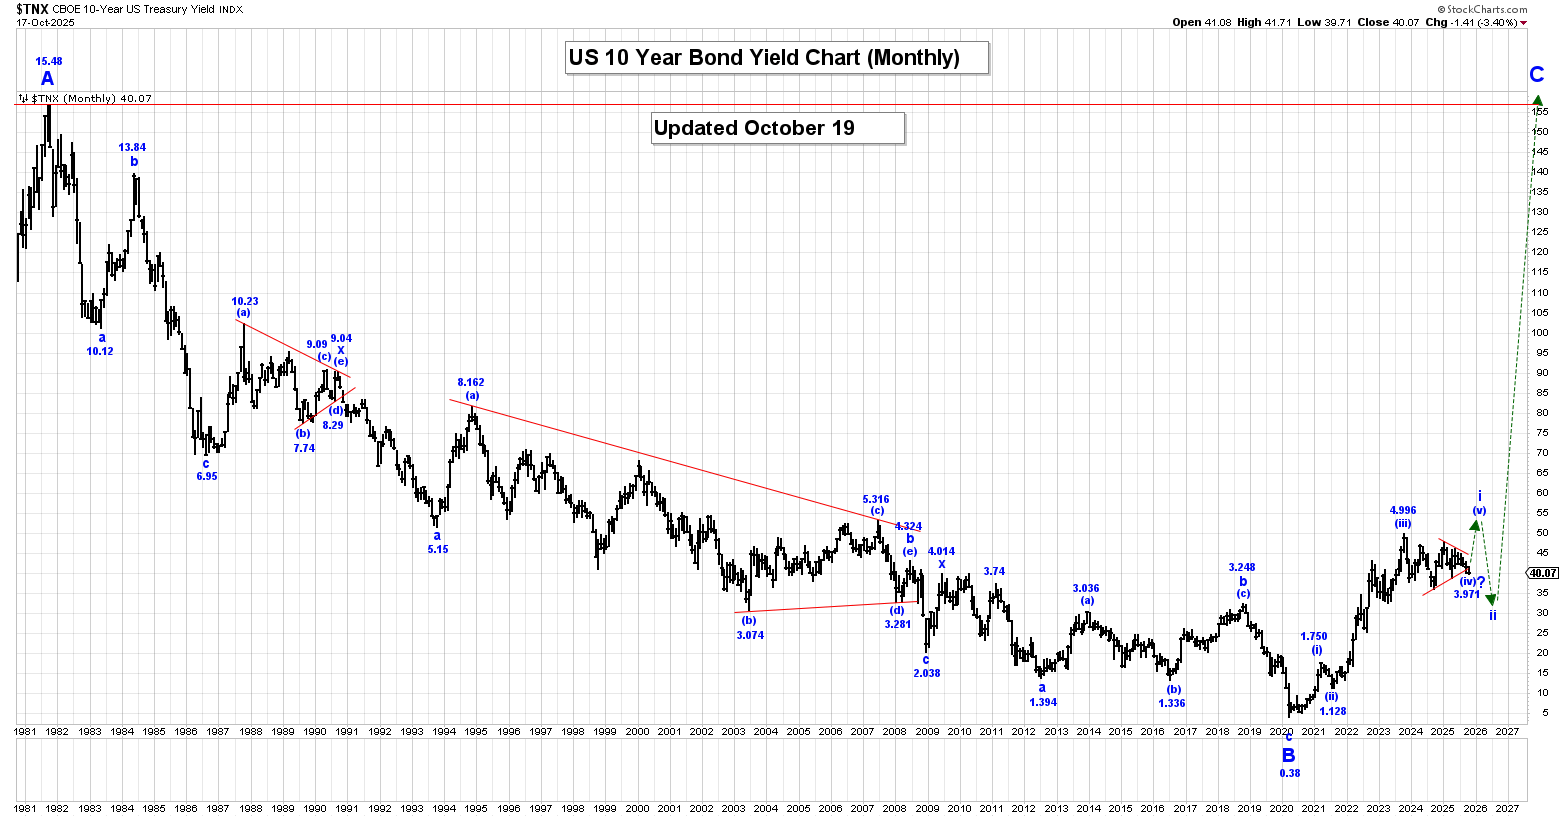
The 10 Year US Bond Yield was lower again this past week reaching a low of 3.971%, closing at 4.007%.
Within a multi-year wave C, we are rallying in wave i, which is now still underway.
Within wave i, we completed wave (i) at 1.266%, wave (ii) at 0.504%, wave (iii) at 4.997% and we are now correcting in a large wave (iv) bullish triangle, which could now be complete at the 3.971% low.
After our wave (iv) bullish triangle ends we expect a very sharp thrust higher in wave (v) to complete all of wave i.
We will provide our projected endpoints for wave (v), later next week in one of our Morning Posts.
Based on the size of the bullish triangle a spike high to 6.00% could be possible.
After wave i ends we expect a wave ii, correction that retraces between 50 to 61.8% of the entire wave i rally.
On our Long-Term Monthly Chart all of wave A ended at the 15.83 high in 1981 and since that high was made, we have fallen in a triple 3 wave correction within wave B that ended at the 0.38% level.
We have now started to rally higher in a multi-year wave C rally that will eventually see rates reach at least the 15.83 high again.
Active Positions: Long, risking to 3.880%!
Crude Oil:
Weekly Crude Oil Chart: https://captainewave.com/wp-content/uploads/2025/10/ewoc1925oil.png
Long Term Update:
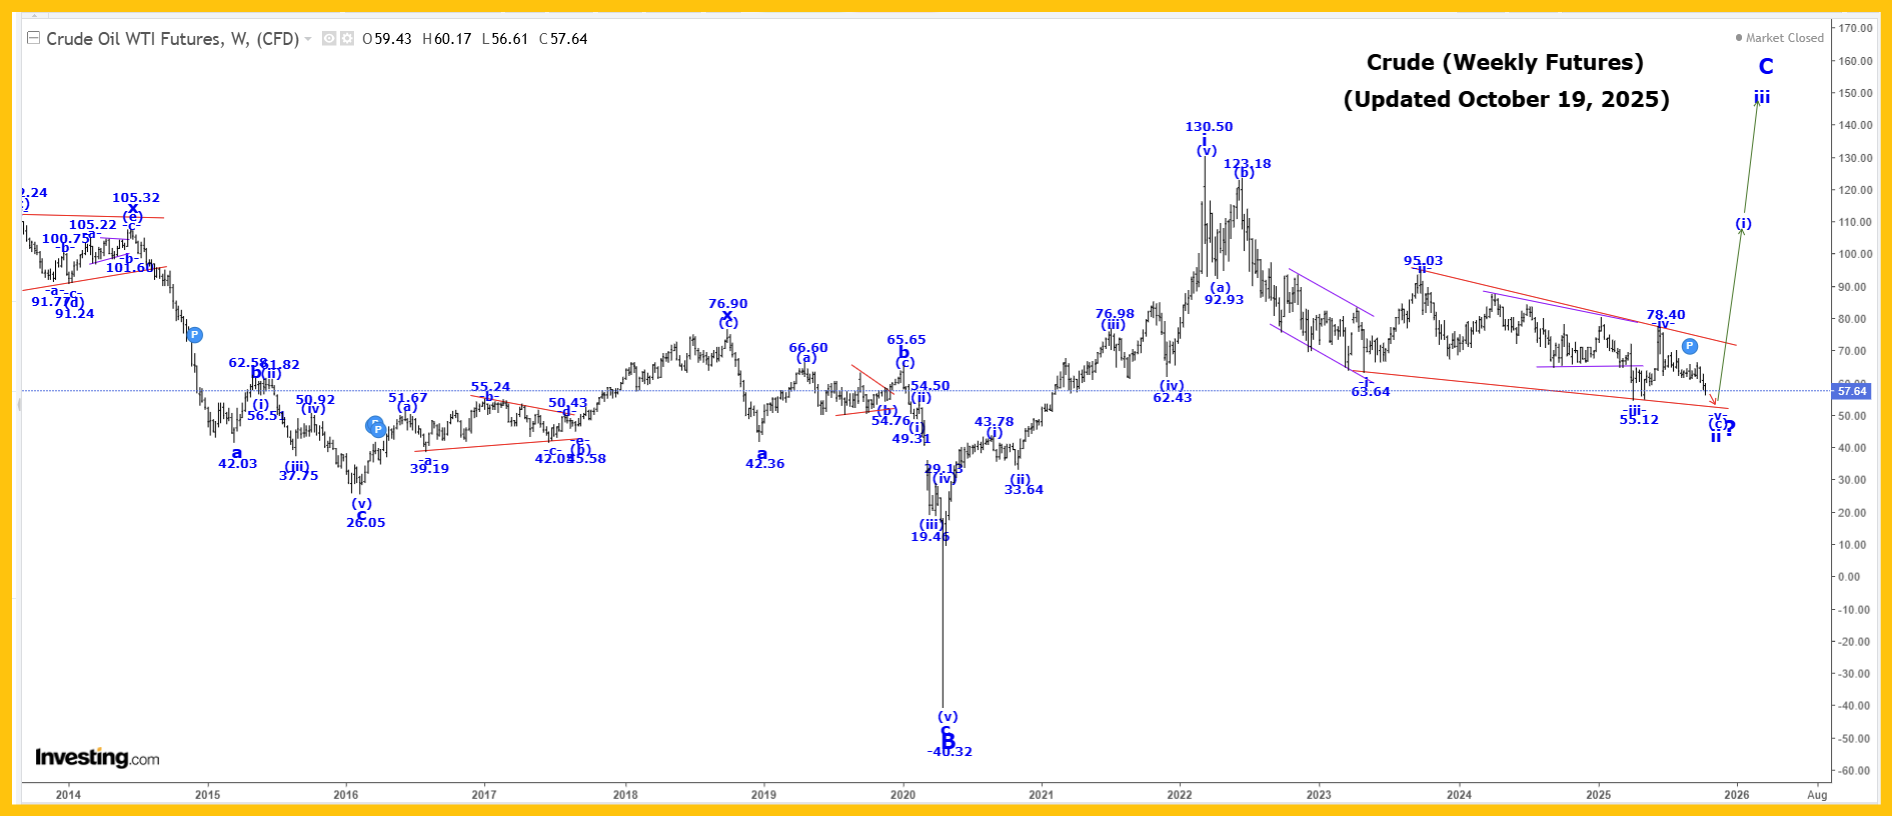
Crude was lower again this past week reaching a low of 56.61, closing at 57.64.
We have updated the internal wave count for Wave ii to look as follows:
(a) = 92.93.
(b) = 123.18.
(c) diagonal triangle:
-i- = 63.64.
-ii- = 95.03.
-iii- = 55.12.
-iv- = 78.40.
-v- is still underway, with a minimum target of 55.12.
It is looking like wave -v- may also be an ending diagonal triangle formation that remains incomplete.
After wave ii ends we expect a very sharp rally higher in wave iii, and we will provide our projected endpoint for its completion after wave ii ends.
In the long term we are now rallying in wave C that has the following projections:
C = A = 153.77.
C = 1.618A = 244.78.
Suncor:
Weekly Suncor Chart: https://captainewave.com/wp-content/uploads/2025/10/ewoc1925su.png
Long Term Update:
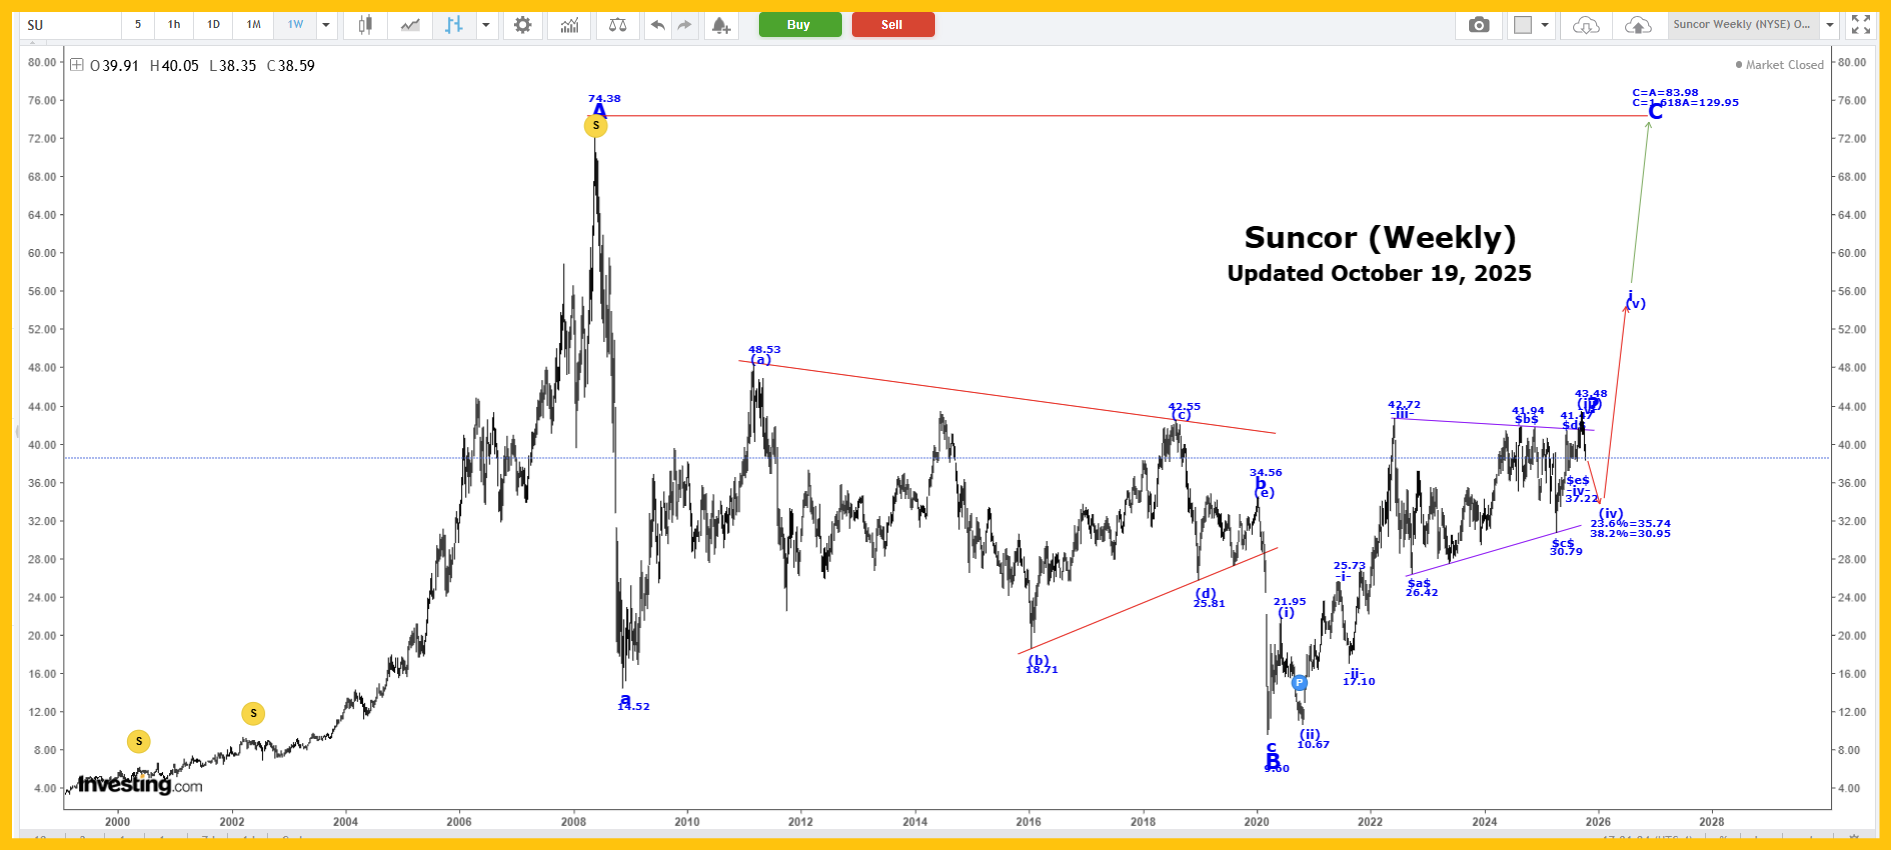
Suncor was also lower again this past week reaching a low of 38.36, closing at 38.59.
We are now working on the assumption that all of wave (iii) is complete at the 43.48 high and if that is the case then we are now falling in wave (iv), which has retracement levels as follows:
23.6% = 35.74.
38.2% = 30.95.
We expect lower prices as wave (iv) continues to develop.
Active Positions: Long crude, with puts as a stop. Long Suncor!
SP500:
Weekly SP500 Chart: https://captainewave.com/wp-content/uploads/2025/10/ewoc1925sp.png
Long Term Update:
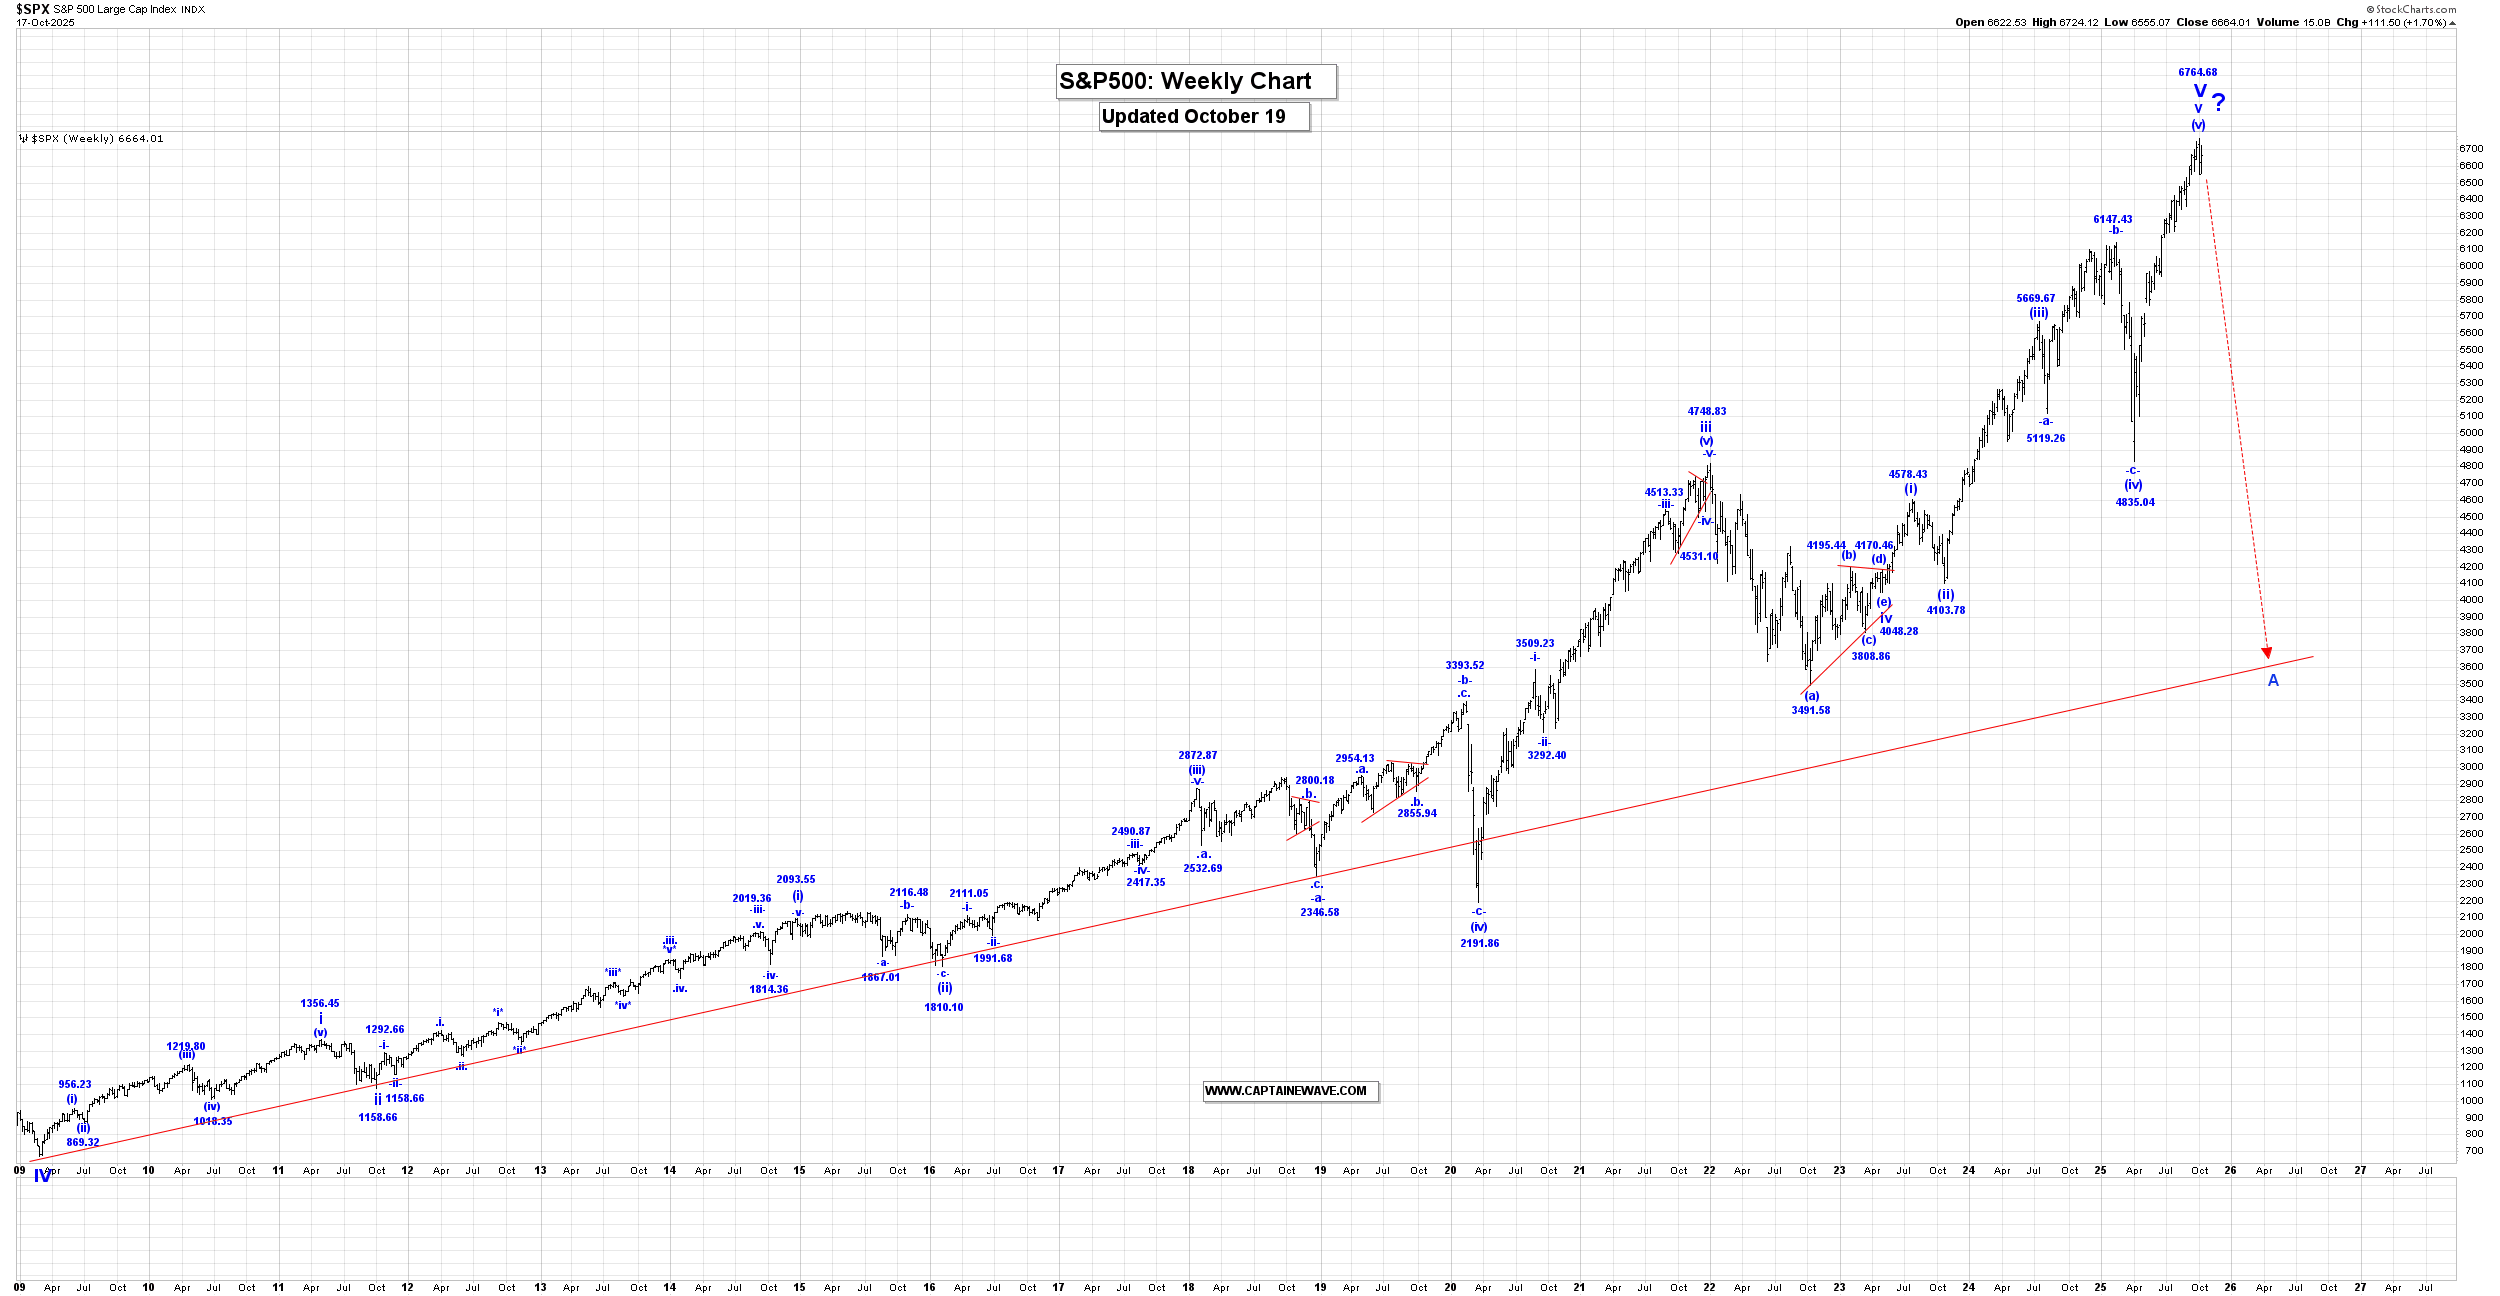
The SP500 was sharply higher this past week reaching a high of 6724.12, closing at 6664.01!
Within v of V, wave (iv) ended at 4835.04 and we are moving higher in wave (v), which has the following internal wave count:
.i. = 5381.55.
.ii. = 5104.34.
.iii. = 6427.02.
.iv. = 6212.89.
.v. = 6764.68, if complete.
We are waiting for confirmation that all of waves .v., (v), V and V are complete at the 6764.68 high.
This upcoming rally should be shorted, with stops at 6765.00.
Active Positions: Short with calls as stops!
USDX:
Weekly USDX Chart: https://captainewave.com/wp-content/uploads/2025/10/ewoc1925usd.png
Long Term Update:
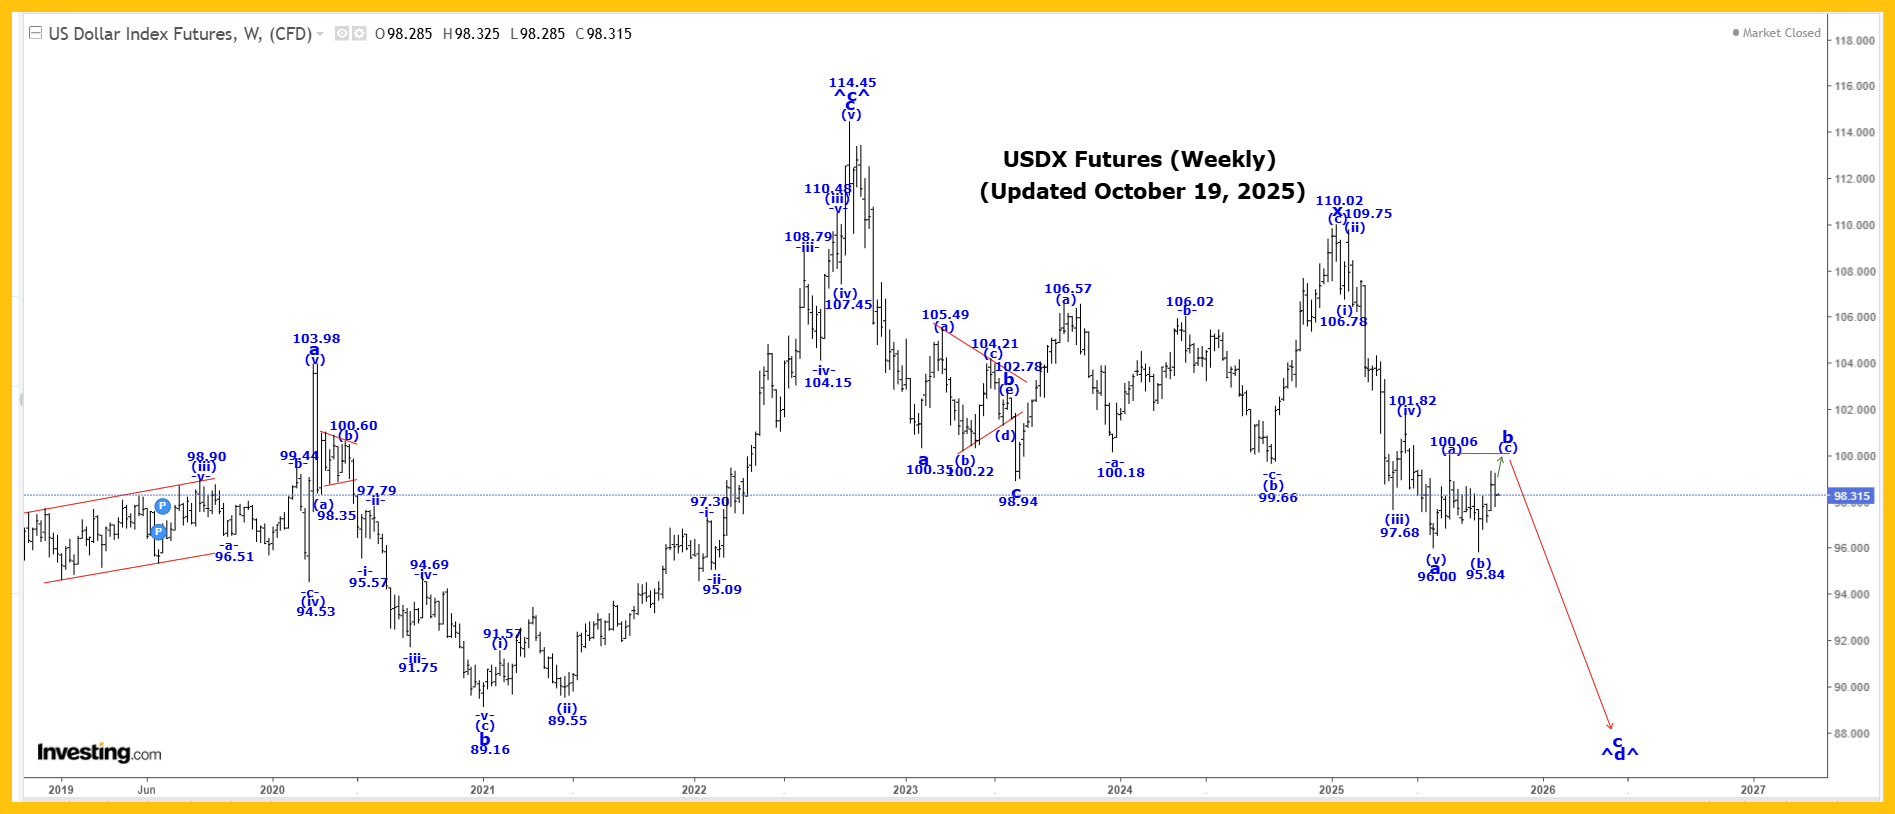
The USDX was lower this past week reaching a low of 97.81, closing at 98.31!
We continue to work on a very large wave B bearish triangle and within that triangle all of wave ^c^ ended at the 114.75 high. We are now falling in wave ^d^.
Wave ^d^ cannot fall below the wave ^b^ low of 71.46 for this triangle formation to remain valid. Wave ^d^ needs to consist of at least one abc pattern but can have up to 3 such patterns.
We have now made a major revision to the internal wave structure of wave ^d^ and now believe that it will consist of at least 2 three wave patterns as follows:
a = 100.35.
b triangle = 102.78.
c = 98.94.
x = 110.02
a = 96.00
b is now underway.
Within our second wave b, we completed wave (a) at 100.06, and wave (b) at 96.84, so we should now be moving higher in wave (c). What we do not know is what formation our second wave b is going to take.
It could be a flat or bearish triangle. Wave (c) within our bearish triangle wave b may have ended at the 99.31 high, and if that is the case then we should be heading lower in wave (d), which cannot drop below the wave (b) low of 95.84.
After our second wave b ends, we expect a drop in our second wave c.
Active Positions: Short, risking to 104.00!
CDNX:
Weekly CDNX Chart: https://captainewave.com/wp-content/uploads/2025/10/ewoc1925cdnx.png
Long Term Update:
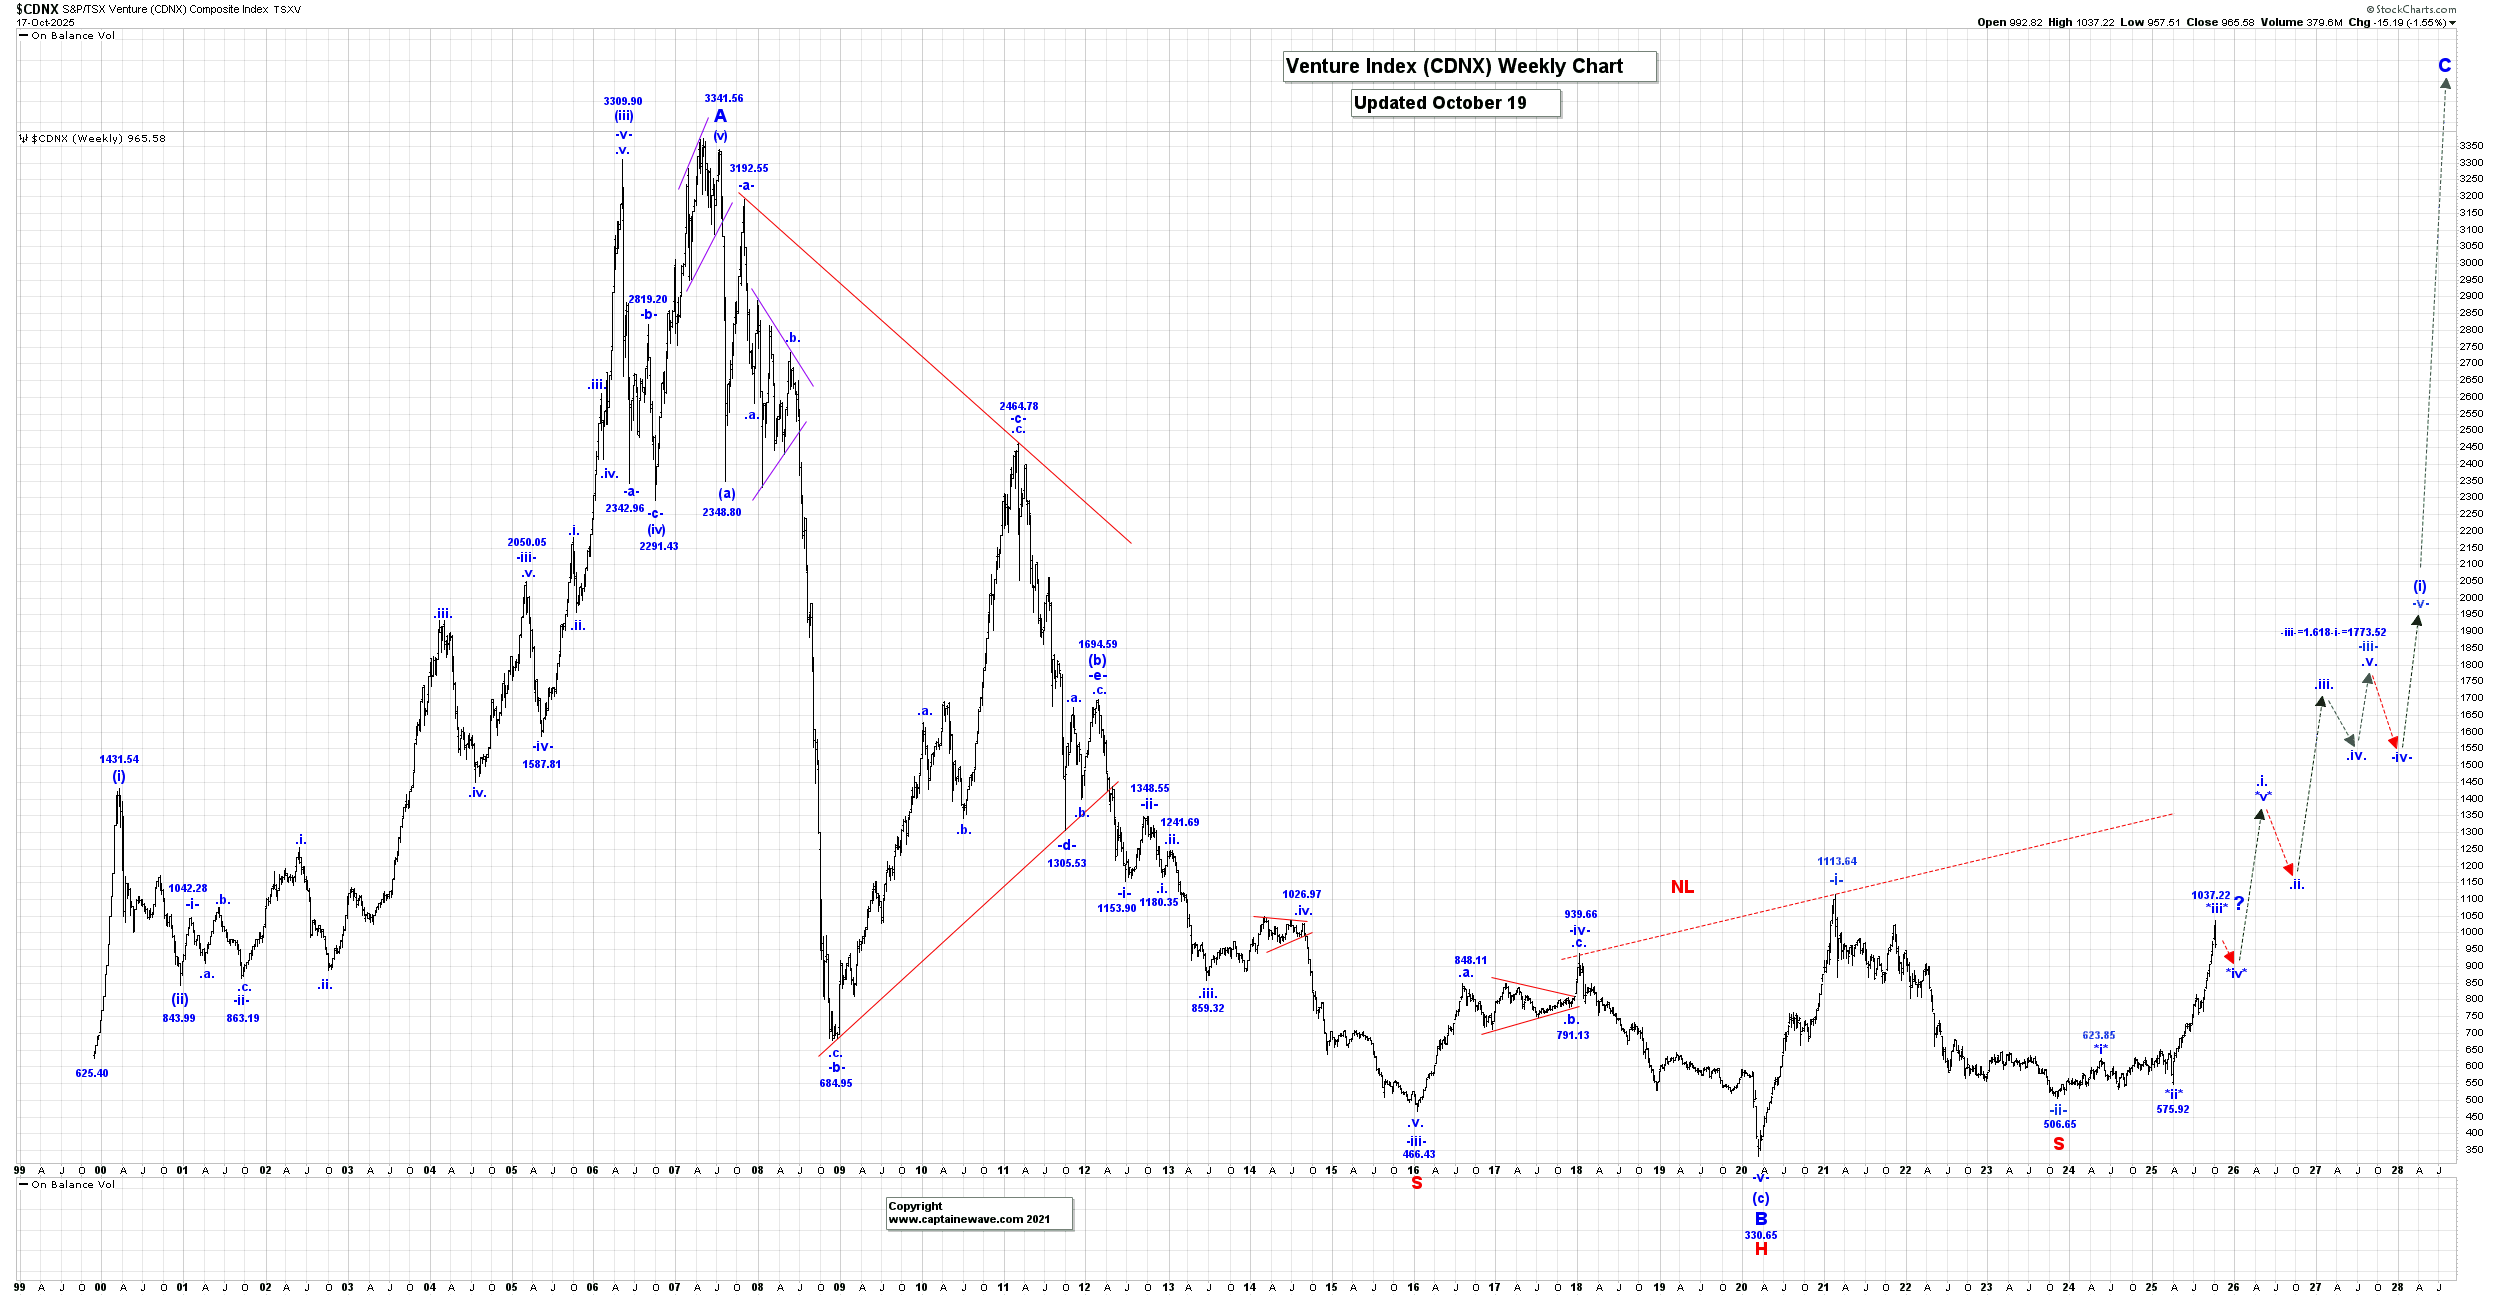
The CDNX was initially higher again this past week reaching a high of 1037.22, although after that high was made we moved lower reaching a low of 957.51.
Wave -ii- is now complete at the 506.65 low, and we are moving higher in wave -iii-, and within wave -iii- we are working on wave .i..
Within wave .i., we completed wave *i* at 623.85, wave *ii* at 575.92, and we still appear to be working on an extending wave *iii*. After wave *iii* ends we expect a wave *iv* correction that should retrace between 23.6 to 38.2% of the entire wave *iii* rally.
Longer term our initial projections for the end of wave -iii- is:
-iii- =-1.618-i- = 1773.52.
Our minimum multi-year long term target for the end of wave C is 3341.56.
Active Positions: Long the GDXJ and key CDNX juniors, for a long-term hold!
GDX:
Weekly GDX Chart: https://captainewave.com/wp-content/uploads/2025/10/ewoc1925gdx.png
Long Term Update:
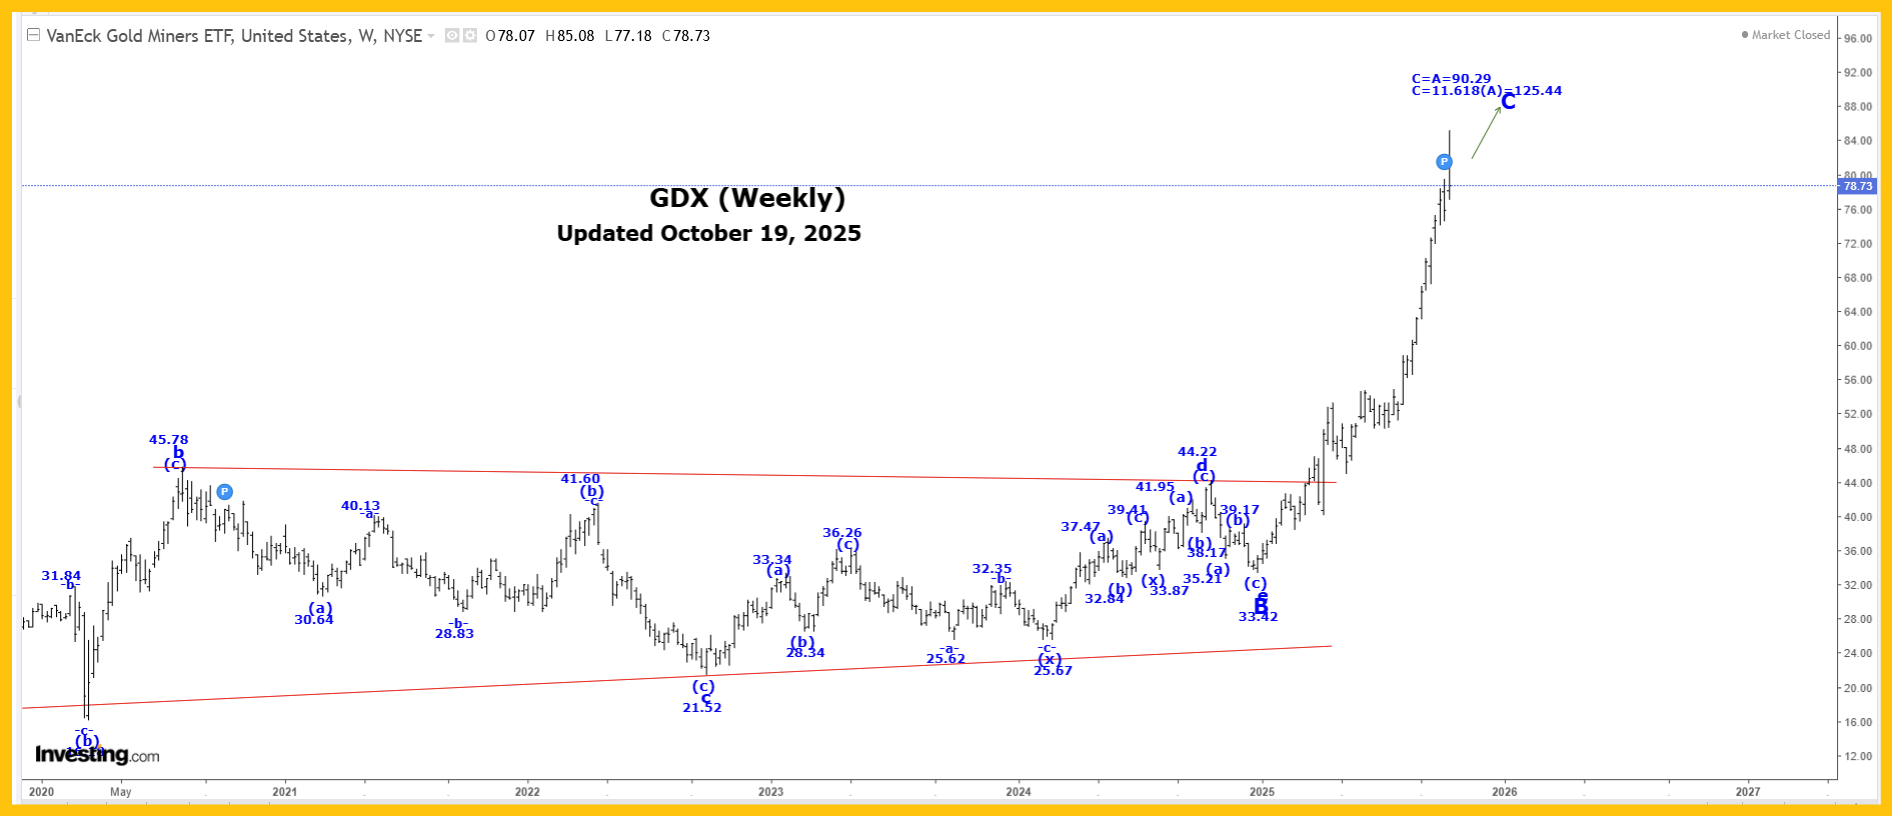
The GDX was higher this past week reaching another all-time high at 85.01, closing at 78.73!
All of wave A ended at the 56.67 high in 2008 and all of our bullish wave triangle at 33.42, and we are continuing to move higher in wave C.
Our initial projections for wave C are:
C = A = 90.29.
C = 1.618A = 125.44.
Within wave C, we completed wave (i) of i of C at 42.54, wave (ii) at 38.58, and we are still moving sharply higher in a subdividing wave (iii), which could have ended at the 85.08 high and if that is the case then we should now be starting to correct in wave (iv).
Active Positions: We are long the GDX, ABX, KGC, NEM, SSSR, and TSX:XGD… with no stops!
Bitcoin:
Weekly Bitcoin Chart: https://captainewave.com/wp-content/uploads/2025/10/ewoc1925bit.png
Long Term Update:
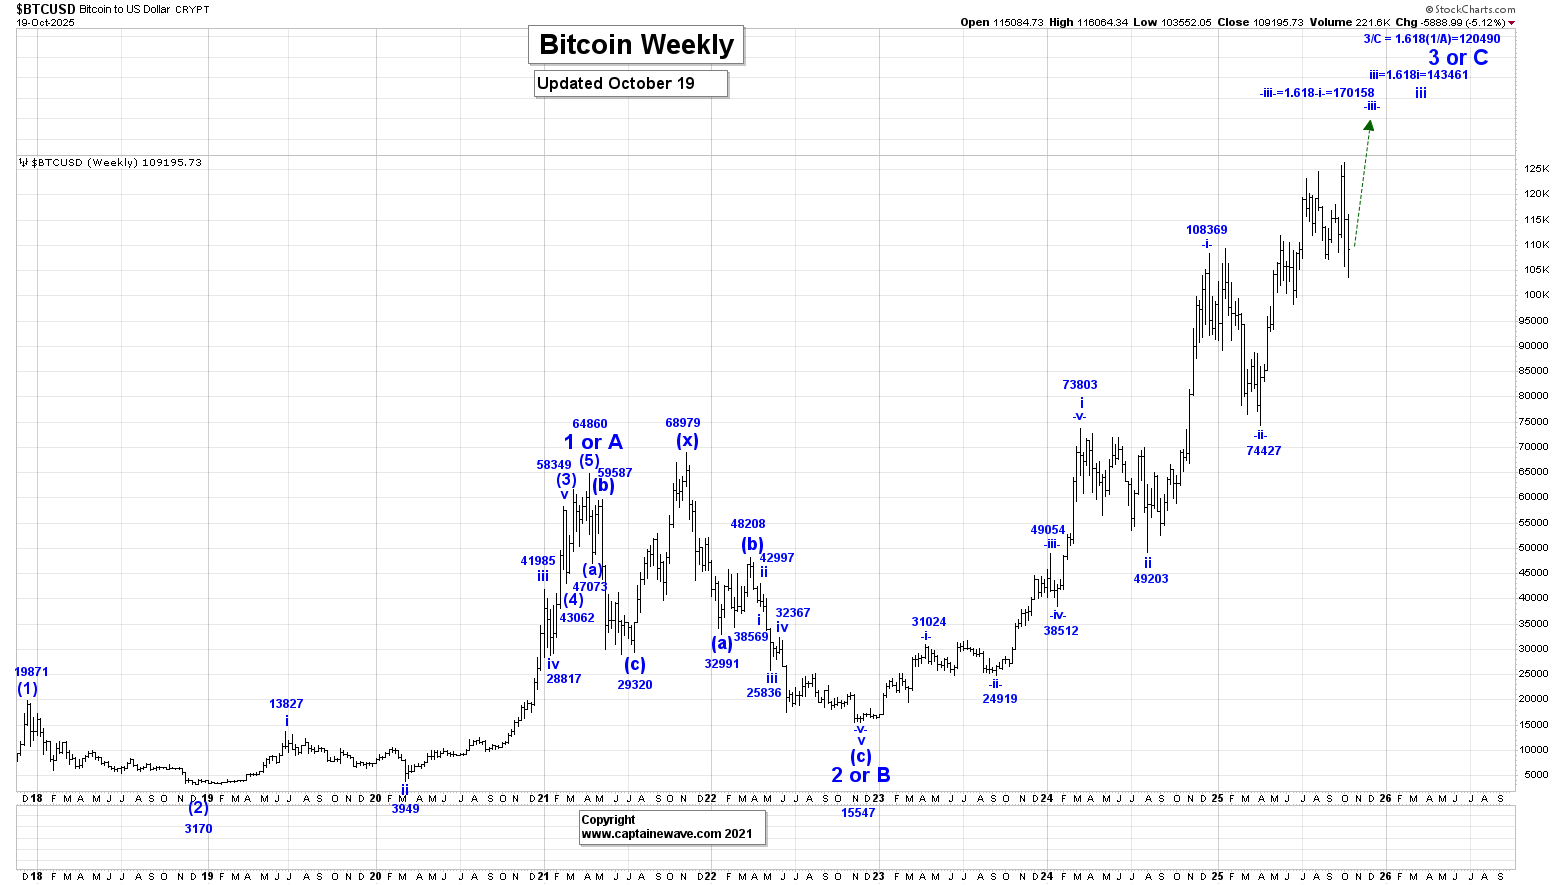
Bitcoin was sharply lower this past week reaching a low of 103,552, closing at 106,888!
All of wave 1 or A is now complete at the 64,860 high and wave 2 or B at the 15,547 low.
Within wave C or 3, we completed wave i at the 73,803 high and wave ii at the 49,203 low. We should still be moving higher in wave iii, which has an initial projected endpoint of:
iii = 1.618i = 143,641.
Within our now subdividing wave iii, we completed wave -i- at 108,369 and wave -ii- at 74.427, and we are now moving higher in wave -iii-, which has an initial projected endpoint of:
-iii- = 1.618-i- = 170,158.
Our current projected endpoint for wave 3 or C is:
3/C = 1.618A = 120,490.
We still expect higher prices lie ahead.
Active Positions: Flat!
Thanks!
Captain & Crew